Ch 08 : Result sets, manipulation, custom reports and visualisation
- Ch 8: Result Views and Export
- 8a: Getting started with custom reports
- 8b: Custom reports - Advanced functions
- 8c : Mapping & Visualisation
- 8d: Summary : Mapping and visualisation
- 8e: Using IIIF - manifests, canvases and annotations
- 8a bis: Custom reports OLD VERSION
Ch 8: Result Views and Export
Documentation written on 04/11/2025 by Sylvain Besson (MSH Lyon Saint-Étienne / CNRS)
Updating 25/06/2026 by Vincent Paillusson (HTL)
1. Record View
Explore → Filter → Record
The Record view shows all the elements of a recording. The differents fields and associated metadata and possibly relationship between recordings.
How to start:
- To begin, click on [Explore]. ①
- Perform a search or use a [Saved Filter] that returns the records you want to include in your report. ①
- Select a record ②
- Click on [Record] ③

Once on the [Record] view selected, the record’s metadatas appear. There is several informations:
- Title ①: title of the record
- Icon ②: record’s type icon
- Record H-ID ②: Intern Heurist record ID
- Workflow stage ④ which give some information on the workflow stage
- Media ⑤: Picture of the media

Focus on medias
- If a media exists in the record, a thumbnail is displayed
- It is possible to display in [full screen]
 ① or viewing it in popup
  ②
② - The media can also be displayed on [Mirador] (using Heurist’s automatic IIIF manifest) ③ or [OpenSeadragon]
 viewer ④
 - You can [download]
 it ! ⑤
 - By hovering over [description], a description appears if this field has been completed ⑥
- Finally by going over [rights], the rights of the media appears if it was filled during the record creation ⑦

Click on [More…]
- Cite as ① : The record can be cited in XML or HTML. The updating date of the record is shown as the lastest modification date.
- Added ②: Creation date of the record
- Updated ③: Last record update
- Ownership ④: Communicate who owns the record and who can read it
- Rating ⑤: You can rate each record from one to five
- Tags ⑥: You can tag records to find them more easily

2. List view
Explore → List View
[List view] allows essentialy to show the whole selected data in table format ③.
You can choose the field you need ①. You can also save the settings ②. It is also possible to export by simple copy/past (CSV with tab as separator), by excel format and PDF format ③.

🛟
Tip: If you want to export data with more export formats, you may want to try the Export view described in the following section.
3. Export View
The Export view allows to export the request results under differents data formats:
CSV ①
XML ②
JSON ③
RDF ④
GeoJSON ⑤
KML ⑥
GEPHI ⑦
IIIF ⑧
HuNI ⑨
Several formats can be exported as a data feed, as well as a fixed format file. The data feed capability is particualrly useful for sending live data to a processing workflow, often combined with a saved search which filters the required set of output records. It can be a very useful, simpler alteraitv eto usign th Heurist API.

CSV / TSV (Delimited) files
When you click on [CSV], a pop-up opens allowing you to choose the fields you want to export and a range of settings.
Note that by default CSV files are exported as tab-separated, since this causes much fewer problems with complex text (which often contains commas and unmatched quote marks, but very rarely contains actual tab characters)
CSV/TSV exports are a particularly good way of temporarily exporting some fields, carrying out some manipulation in an externa program eg. a spreadsheet, Open Refine or R, and reimporting the results with Populate > Import - Delimtied text / CSV. Because all exported CSV/TSV files automatically include the Hursit ID (H-ID)_ which is uniqiue to each record, it is very easy to reimport the data into the soure records, overwriting or adding to existing values in the same or differnet fields.
First, you must choose the records you want to export ①. You can choose between the current result set and any single type of record occuring within the resultset.
We STRONGLY recommend only exporting one record type at a time. Delimited files are really not meant for dealing with heterogeneous data, and mixed exports will restrict the exportable fields to record metadata and shared fields.
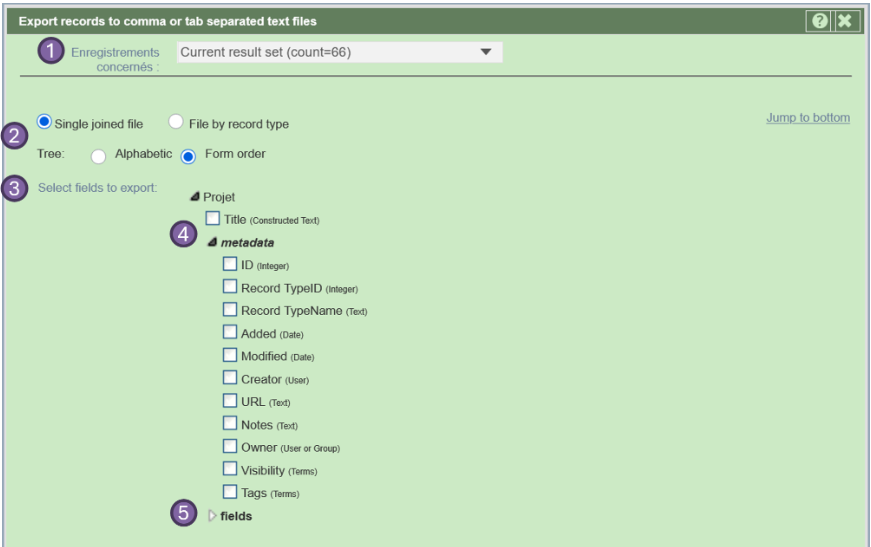
After the records selection, you choose one of the two available export settings ② :
- a single joined file
- a file by record type (if multiple types are selected).
You can choose to display the fields in either Form order (the default) or alphabetic order. Alphabetic order may make it easier to select fields in some circumstances.
The main step of the export setting is to select the fields you want to export ③ . They can be any type of field including the constructed title, record pointers and relationship markers.
You can export metadata about the records ④ as well as the data from the data fields ⑤ .
If you have a current resultset with more than one record type in it, you will only be able to choose the metadata and fields which are shared by all the record types in the resultset.
If the record type you are exporting contains record pointer or relationship marker fields, you can drill down into those record types and export fields from within those records. They can be included in the main file ("single joined file") or exported as separate files with linking IDs ("File by record type").
You should use "File by record type" where there are multiple values in record pointer fields, since the values in each related record will need to be kept separate. For simple cases without repeated value record pointers "single joined file" may be appropriate.
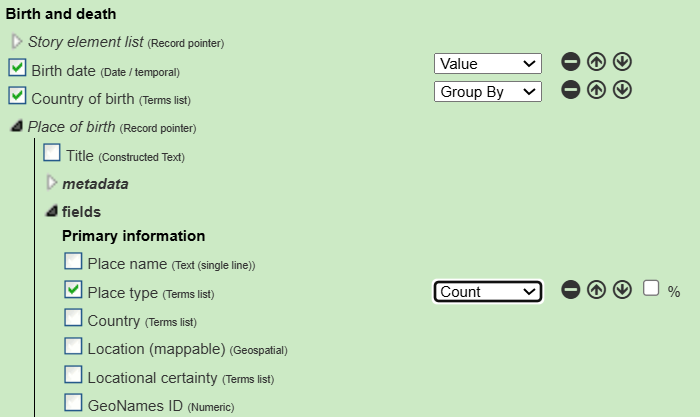
Note how you have some additional options appearing on the right against any selected fields.
For most purposes you will want to use Value, as the other options can be done more effectively in an external spreadsheet. However Group by will group records into a single record for each value encountered in the column, while Count will count the number of occurrences for the field in those groups. The results can be a little hard to interpret.
🛟 Tip:
The H-ID is ALWAYS included in the export because it uniquely identifies every record, so it is essential if you need to import/update data back into the database or to make links between records eg. record pointers
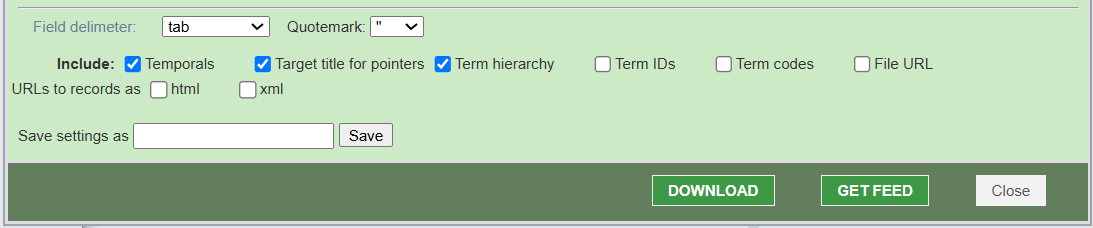
Finally, when ending the CSV export setting, you can change the field/column delimiter for the csv (for example: tab, semicolon, comma, etc.) and character used for quotemarking the textual content.
You can also save settings ⑦ by giving it a name in order to use it later.
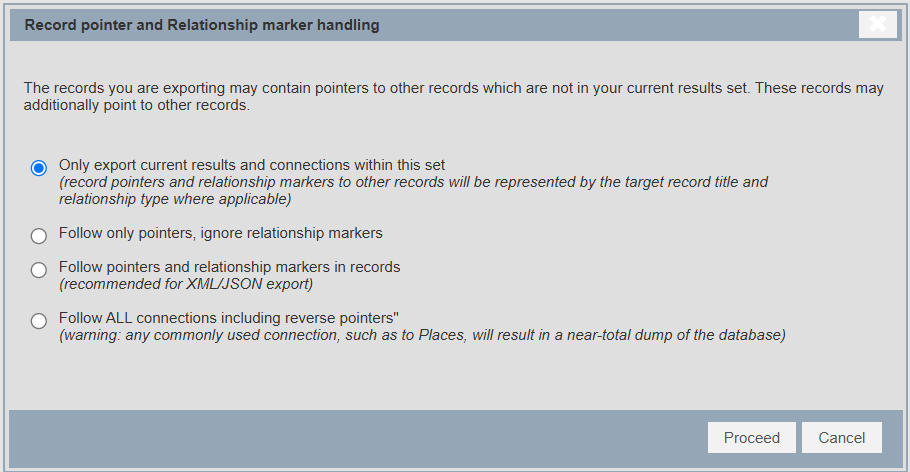
Handling of record pointers and relationships
For all other export types, it is possible to choose between:
- Export the records and their relationships (relationship of the type pointer or the relationships maker)
- Export only the pointer relationships
- Don’t follow the pointer relationships or the relationships makers
- Follow all relationships including inverse pointers (🚨warnings: it could export the entire database)
XML
“Extensible Markup Language (XML) is a markup language and file format for storing, transmitting, and reconstructing data. It defines a set of rules for encoding documents in a format that is both human-readable and machine-readable.” (source: Wikipedia)
Heurist defines an XML schema called Heurist Markup Language (HML). HML can be used both as an interpretable archivable format (it is included as the primary element of Publish > Safeguard file) and as a data source which can be transformed with XSLT transforms, Python, PHP, or many other languages to a required format.
Check the box "Include human-readable names and local IDs for everything" if you plan to look at the XML file and interpret its structure (this will create a very large file duer to repetition). It is often better to export an explanation of the structure through Populate >Heurist XML/JSON - Download template.

JSON
“JSON (JavaScript Object Notation) is an open standard file format and data interchange format that uses human-readable text to store and transmit data objects consisting of name–value pairs and arrays (or other serializable values).” (source: Wikipedia)
The choices are similar to XML/HML, except that it cannot include the human readable forms. However, as with XML, you can download the information in the form of a JSon tempalte through Populate >Heurist XML/JSON - Download template.
RDF
“The Resource Description Framework (RDF) is a method to describe and exchange graph data.” (source: Wikipedia)
In this format, you can specify the serialisation you want: rdfxml, json, ntriples or turtle
As this function is still in development (July 2026) it requires a special password to access. Contact the Heurist development team for further information.
GeoJSON
“GeoJSON is an open standard format designed for representing simple geographical features, along with their non-spatial attributes. It is based on the JSON format.” (source: Wikipedia)
You can select the export detail between: No = no detail, Inline = Inline detail, and Full = maximum detail
KML
“Keyhole Markup Language (KML) is an XML notation for expressing geographic annotation and visualization within two-dimensional maps and three-dimensional Earth browsers. It is best known for its use in Google Maps but is widely importable into GIS and mapping packages” (source: Wikipedia)
There are no options for this export format, it is exported immediately as soon as you click on the button.
GEPHI
GEPHI export generates a GEFX file which can be loaded immediately into GEPHI. Note that this export function is also available directly within the network visualisation graph in the Network tab.

In addition to the normal node and edge fields, you can choose to add additional fields to the export ①.

This leads to the pop-up below. We recommend only selecting fields relevant to the record type being exported. You can also export with jsut the default fields ② which will be sufficient in most cases.
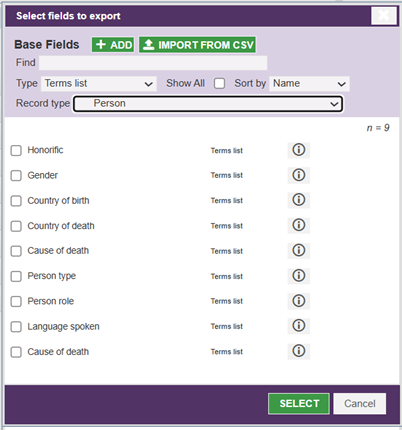
🛟 Tip:
It can be useful to check the box limiting the export to the first 1000 nodes in order to check that the export gives you what you want in GEPHI, befor exporting a very large dataset.
IIIF
“The International Image Interoperability Framework (IIIF, spoken as ‘triple-I-F’) defines several application programming interfaces that provide a standardised method of describing and delivering images over the web, as well as “presentation based metadata”[1] (that is, structural metadata) about structured sequences of images” . (source: Wikipedia). IIIF can also handle tiled image delivery andimage annotation.
Heursit acts as both a IIIF manifest delivery system and image server, and as an IIIF display and annotation client, notably through the use of Mirador Vsn 4 and Open Sea Dragon viewers, and the MAE annotation framework. Heurist can also read and atomise manifests containing annotations, and recompose manifests including those annotaitons and others created within Heurist.
IIIF is a rich and complex system. Heurist's IIIF implementation is discussed in detial in chapter 8e.
HuNI
“HuNI (pronounced “honey”) brings together information about the people, works, events, organisations and places that form Australia and Canada’s past and present.” (source: huni.net). It is an old infrastrucute project dating to the 2000s with limited functionality (essentially harvesting simple metadata from 40+ Australian sources, providing simple search, bookmarking as a 'collecction' and exporting a CSV file with title and URL of the bookmarked records. The HuNI export format has the particularity of exporting one XML file per record. It may be of some use if that fits with your needs.
HTML
This option exports HTML pages for public records (one file-per-record) using the Record view format.
📊 Export‑type quick‑reference table – Which format to choose?
Need | CSV | XML | RDF | JSON | GeoJSON | KML | Gephi | IIIF | HuNI |
|---|---|---|---|---|---|---|---|---|---|
Spreadsheet | ✅ | ✅ | |||||||
Markup (tagging) | ✅ | ✅ | ✅ | ✅ | ✅ | ✅ | ✅ | ||
Versatile (generic data) | ✅ | ✅ | ✅ | ✅ | ✅ | ✅ | ✅ | ✅ | |
Spatial (geographic) | ✅ | ✅ | |||||||
Networks | ✅ | ||||||||
High‑resolution images | ✅ |
8a: Getting started with custom reports
Documentation rédigée le 06/11/2025 par Shannon Bruderer mise à jour le 05/12/2025 par Shannon Bruderer
What is a Custom Report ? :
A Custom Report is a template that structures your database records into various output formats such as HTML (for web display), plain text (for transfers without formatting), CSV (for spreadsheet work, e.g. in Excel or Open Office), JSON (for data feeds), or XML (for tagged data exchange).
Note however that CSV, JSON and XML are handled much more easily in the Export tab in Explore unless some very specialised formatting is required.
The development of custom reports can be quite a slow process, so it is best to plan well what reports you need and apply good naming conventions. Some level of simple HTML will be required, and knowledge of CSS will allow for much greater control of the output. PHP and JS functions can also be included (optional).
Custom Reports are useful when you need to extract and format specific data for further analysis or publication. They are particualrly useful in formatting data to appear in web pages (see chapter 9). They can also be used to download formatted information or set up feeds of data for other purposes.
They are also useful for displaying a single record in Record View, a popup on the map, or wherever data needs to be displayed in response to selection of one or more records.
Tip : Before creating your Custom Report, define clearly what sort of display you plan to do. Your formatting goal will determine both the data you select and the way you format the output.
Reports are built using Smarty, a templating language that combines standard HTML with Smarty tags to dynamically insert data from Heurist.
You may see this message above your report format in the middle panel. CSS and JS are disabled by default in report formats and websites generated by a database as a security precaution, to avoid unwanted actions from parasitic databases. If you wish to use these - many websites will want to customise their appearance or behaviours more than the default settings allow - you should contact the server adminstrator who will add the database to a list of authorised databases.

If you change the name of a database, clone it or create a new database it will not allow CSS or JS.
The new name will need to be added to the list.
How to start :
You may wish to perform a more flexible filter, either by entering it in the Filter field ③ or using the Filter builder or Facets builder just below it, or use a [Saved Filter] from the Filters ection ② that returns the records you want to include in your report.
The selected records will appear in the middle section of your screen. ④
To work with Custom Reports, click on the [Report] tab ⑤
The Custom Report template for your filtered data will appear below the [Report] button.

The report shown in the backend interface is limited to 50 records by default (can be increaed to 200 or 500 in Design > My Preferences) and ends with a line stating this limit, as it is really designed as a preview function. To view the full results click the globe or download icons - see below).
The Toolbar
In the upper part of the Custom Report tab, you’ll see a toolbar:

Edit Tool

Click [Edit] to open the template editor and start writing your Custom Report with Smarty.
The editor is split into three panes ①, ⑤ and ⑨
 :::info Tips :
Actions pane ① :
Insert fields, loops, and conditions via dropdown helpers ②, and a tree view ④ selected with the record types dropdown ③
The tree view ④ allows you to select multiple fields, including from the metadata attached to each record (ID, date of addition, owner etc.), the method of representation of term fields (label, description, code), and to drill down into connected records through record pointer fields or relationship markers.
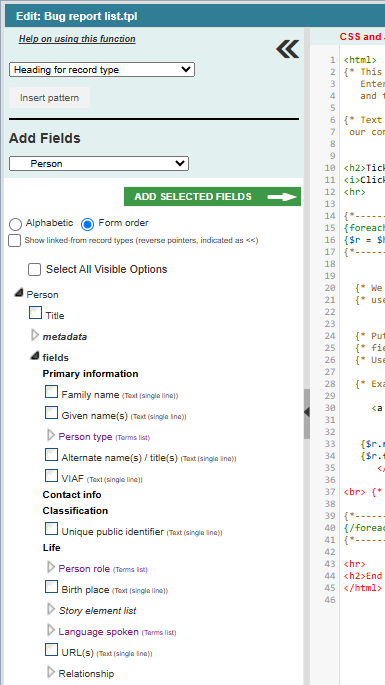
The fields can be organised in record form order (default view, showing the tabs and headings in bold font), or in alphabetic order. The tree can also show record types which have record pointers pointing TO the record type selected (Show linked-from record types checkbox)
Having selected one or more fields, make sure the cursor is positioned where you want them inserted in the report format and click Add selected fields. This will display the following popup;
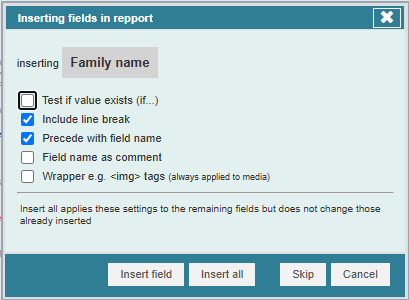
By selecting the checkboxes you can accompany insertion with various additional functions and pieces of information - the two selected by default will be useful in many cases to get some sort of reasonable default output.
Fields can be inserted one-by one (Insert field) allowing the accompanying information to be changed between fields, or you can insert all the remaining fields with the same accompanying information by clicking Insert all. Fields can be omitted with Skip.
The pattern insertion dropdown ② above the treeview function allows insertion of a number of simple html patterns such as tables and record links, as well as patterns to carry out some action eg. writing some label or separator, at the beginning or end of a loop. Note that the list of available patterns may change as new capabilities are added.
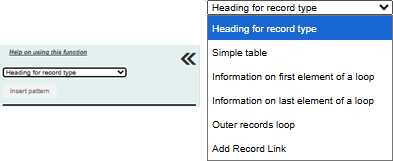
Editor pane ⑤ : write and edit your HTML + Smarty template here.
In the editor, you’ll see the template you selected or the default starter message/template (note that this template may change through time as we improve on it, but it will contain a basic loop for records and some instructions at the end to help you get started).
{* This is a simple Smarty report template which you can edit into something more sophisticated.
It should give basic output for any database, as it uses the standard record types which are part of all databases.
Enter html for web pages or other text format. Use tree on the left to insert fields, loops and tests.
Use this format to include comments in your file, use <!-- --> for output of html comments.
Smarty help describes many functions you can apply, loop counting/summing, custom functions etc. *}
For Smarty syntax please see the following chapter (8b).
Preview pane ⑨ : shows the output when you click [Test] ⑧ .
You can choose to truncate the preview to n records ⑥ and select how to handle debug messages, warnings, and errors ⑦.
Click [Test] to preview ! Nothing is saved when testing.
Use [Save] (or [Save As]) to store your template and keep versions.
Use Ctrl+Z / Cmd+Z to undo recent edits. You can undo a lot of edits by repeating this.
We strongly recommend using the test function frequently making only one or two changes at a time and clicking Test to see the results. If somethign doesn't work, you can immediately undo it and try an alternative. Undo can be applied repeatedly.
Don't get tempted to write a lot of code and then test it because then you will have trouble finding the problem.
Rename

Allows renaming of an existing template. Note that if a template is renamed, any URL or scheduled regeneration which uses the old name will fail.
Create a new template

[Create a new template] works similarly to the [Edit] tool. It opens the same editor interface where you can create a new Custom Report template from scratch.
Use it when you want to start a fresh layout instead of editing an existing one.
For Smarty syntax please see the following chapter (8b).
Delete the Selected Template

The [Delete] tool allows you to delete the currently selected template.
When clicked, a warning message will pop up asking for confirmation.

It will display the name of your template ① like name_file_.tpl . As here for exemple "Basic (inital record types).tpl"
Click [Proceed] to confirm deletion, or [Cancel] to abort the action.
Import and Export Templates


The Import ← and Export → tools allow you to share and reuse Custom Report templates.
For this we have developed a 'global template' format (.gpl) which uses Heurist's unique Concept IDs so that the template can be usd by any database that includes those concepts (definitions of record types, fields and terms). Template files stored in the Heurist database are the same as global files except that they use local codes rather than the unique global concept IDs.
Templates can only be exported from a registered database to ensure that there are Concept IDs for any definitions used in the template. If the database is not registered you will see the following message.

Import lets you upload an existing global template file (.gpl) and convert it to a local template file (.tpl)
Export lets you download your customized template as a .gpl file, so you can back it up or share it with others.
Obtain the URL, JavaScript to embed a report, and set a publishing schedules

The [Publish] option lets you :
- embed a Custom Report in an external website in another CMS
- schedule periodic regeneration with caching for faster load times on large/complex reports.
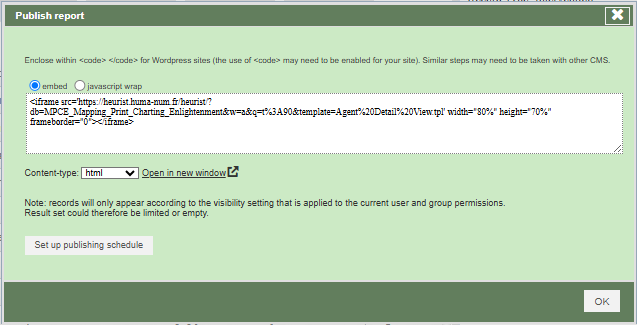
Embedding
The dialogue above gives an iframe instruction to embed the report into another website. Switching to javascript wrap will give an alternative text such as:

The Open in new window link is a useful way of seeing the report cleanly and for obtaining a URL for use elsewhere.
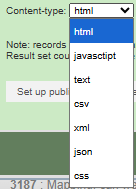
The Content-type dropdown allows a number of differnt output formats to be specified, setting a parameter on the URL used by Open in new window. html and text are the two most useful, the others produce generic outputs which may or may not be of any use. To obtain text output, do not include any html tags in the report format.
Setting up a scheduled (cached) report
Pros/cons of scheduling
Much faster for large tables, complex calculations, or media-heavy pages.
Content is a snapshot at the last generation time (not strictly real-time), so frequency of update needs to be approriately set
The first screen shows any existing scheduled actions:
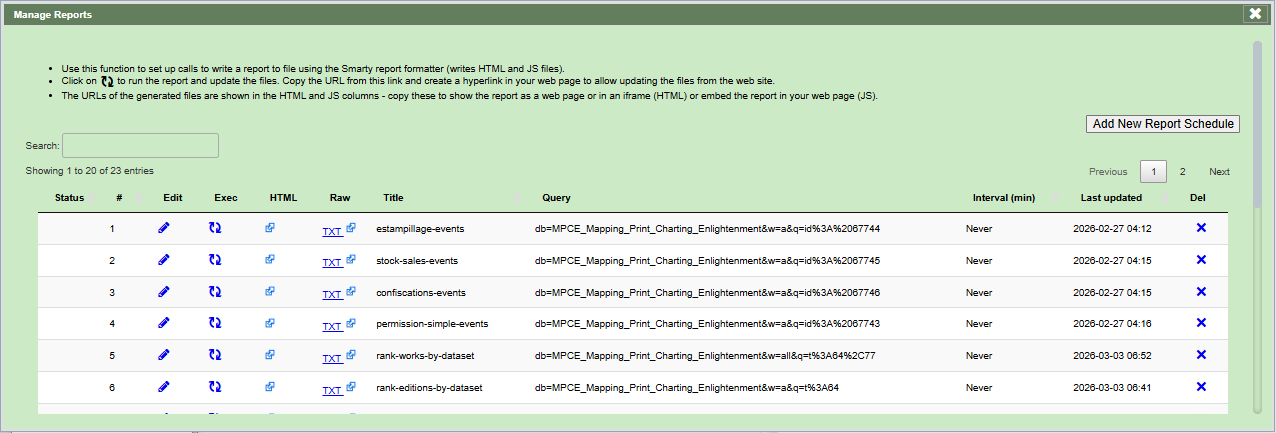
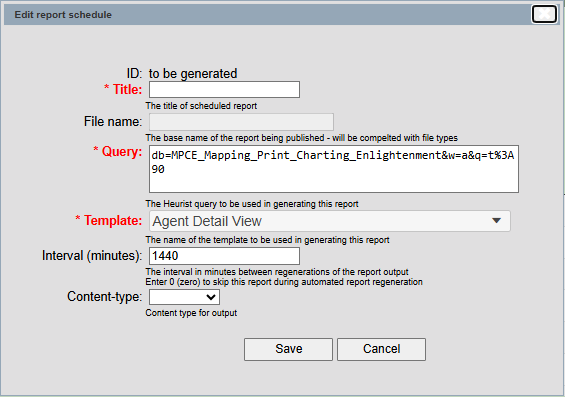
Adding a new report schedule pops up a dialogue to define the parameters of a new schedule using the current filter ("Query") with a number of different options - a title to identify it, the report template to be used, the frequeny with which to regenerate the output (the default value of 1440 minutes = daily, 0 = only manual regeneration, which is useful for data that will never, or very rarely, change).
Download

This allows the download of a plain text file without html formatting (assuming you did not use html tags in the report format)

The [Print] buttom simply generates a PDF of the output from your current Custom Report template. It’s a quick and convenient way to export information in an easy readable and shareable format.
Tip: Don’t hesitate to use this feature to:
Enrich your Data Management Plan (DMP),
Place in a hardcopy archive,
Keep track of specific datasets, or
Share information with colleagues who may not be comfortable navigating Heurist or other “sophisticated” data formats.
Refresh

Click on the [Refresh] buttom to update the data used by your Custom Report template. For filters other than Facet filters (where you must make surther selections) you may also simply hit the Filter button to rerun the filter, which will cause the report to be rewritten.
If your database has been modified (new records, edits, deletions) but the output of your report does not reflect these changes, simply hit Refresh to reload the most recent data and ensure your preview is accurate.
8b: Custom reports - Advanced functions
Advanced topics in custom reports
Note (July 2026): the content was copied via markdown export and lost much of its minor formatting. The images in particular have been downgraded. The original source is here: https://docs.google.com/document/d/1Jyytaln1-aCm3paZ4rBKho0puXBGaJ97/edit
This chapter contains lots of undigested tips for advanced users, skip the first 10 pages or so to get to this material.
Smarty Syntax
If you are not familiar with Smarty or the Smarty syntax, the Smarty Site has a range of information and resources on using the Smarty Report Template Engine, including complete Smarty documentation.
This topic provides an introduction to some basic syntax elements when you are using the Actions Pane to create simple reports.
Advanced features
SMARTY provides a range of features that can improve your reports. For a full explanation, visit the SMARTY documentation.
Template plugins
Template plugins provide advanced template functionality. Template plugins include:
- Functions
- Block Functions
- Modifiers
Plugins are always loaded on demand. Only the specific modifiers, functions, resources, etc. invoked in the templates scripts will be loaded. Moreover, each plugin is loaded only once, even if you have several different instances of Smarty running within the same request.
Main records
The foreach statements enclose a loop which outputs information for each record in the query result. Fields can be inserted with the insert links next to each field. Use the if links to insert tests based on the value of a field (e.g.. to only output text if a field is set).
Subrecords
Further loops can be inserted to output multiple sub-records within the main record loop, using the loop link after the subrecord name. Fields within sub records can be inserted with either the in or out links; use the in link to insert a field within a loop, use the out link to insert a field outside a loop.
Comments
Syntax: {* This is a comment *}
Comments are useful for making internal notes in your template. They are completely ignored in your template file and are invisible to public view (unlike <!-- HTML comments -->).
Variables
Synatx: $foo
Variables allow you to dynamically replace the variable by data when the web page is created. For example, instead of writing the record title in the template, you can use a tag like {$title} in place of the title.
Variables can contain numbers, letters and underscores.
You can apply maths to variables that contain numbers. For example:
{$foo+1}
{$foo*$bar}
{$foo->bar-$bar[1]*$baz->foo->bar()-3*7}
Smarty has several different types of variables. The type of the variable depends on what symbol it is prefixed or enclosed within.
Variables in Smarty can be either displayed directly or used as arguments for functions, attributes and modifiers, inside conditional expressions, etc. To print a variable, simply enclose it in the delimiters so that it is the only thing contained between them.
Arrays in Smarty reports
- You may use arrays in smarty report easily. Access element by its index First element: {$newValue[0]}<br>
Or use standard array functions.Print array: {print\_r($newValue,true)}\<br\> Implode array: {implode('\*', $newValue)}\<br\>
Functions
Smarty has many built in functions for formatting, sorting, totalling etc.
You can also use PHP functions (built-in or ones you define in the code) in a Smarty template, for example:
{$r,fldname} will output the value of the field
{$r.fldname|upper} will output the value of the field converted to upper case (Smarty function)
{str_pad($r.fldname},10,"0", STR_PAD_LEFT) } will pad the string to length 10 with leading zeroes (PHP function)
Every Smarty tag either prints a variable or invokes some sort of function. These are processed and displayed by enclosing the function and its attributes within delimiters like so: {funcname attr1="val1" attr2="val2"}.
Smarty allows for:
built-in functions. For example, {if}, {section} and {strip}. There should be no need to change or modify them.
customer functions. These are additional functions implemented by you via plugins. They can be modified to your liking, or you can create new ones.
Built in functions include:
{assign}
This is used for assigning template variables during the execution of a template.
{assign var="name" value="Bob"}
{assign "name" "Bob"} {* short-hand *}
The value of $name is {$name}.
The above example will output:
The value of $name is Bob.
{$var=...}
This is a short-hand version of the {assign} function. For example:
{$name='Bob'}
The value of $name is {$name}.
The above example will output:
The value of $name is Bob.
{for}
The {for}{forelse} tag is used to create simple loops. The following different formats are supported:
{for $var=$start to $end} simple loop with step size of 1.
{for $var=$start to $end step $step} loop with individual step size.
{forelse} is executed when the loop is not iterated.
For example:
<ul>
{for $foo=1 to 3}
<li>{$foo}</li>
{/for}
</ul>
The above example will output:
<ul>
<li>1</li>
<li>2</li>
<li>3</li>
</ul>
Another example using MAX attribute.
$smarty->assign('to',10);
<ul>
{for $foo=3 to $to max=3}
<li>{$foo}</li>
{/for}
</ul>
The above example will output:
<ul>
<li>3</li>
<li>4</li>
<li>5</li>
</ul>
Example showing use of {forelse}
$smarty->assign('start',10);
$smarty->assign('to',5);
<ul>
{for $foo=$start to $to}
<li>{$foo}</li>
{forelse}
no iteration
{/for}
</ul>
The above example will output:
no iteration
{if},{elseif},{else}
Every {if} must be paired with a matching {/if}. {else} and {elseif} are also permitted.
The following is a list of recognized qualifiers, which must be separated from surrounding elements by spaces. Note that items listed in [brackets] are optional. PHP equivalents are shown where applicable.
Qualifier | Syntax Example | Meaning |
|---|---|---|
== | $a eq $b | equals |
!= | $a neq $b | not equals |
> | $a gt $b | greater than |
< | $a lt $b | less than |
>= | $a ge $b | greater than or equal |
<= | $a le $b | less than or equal |
=== | $a === 0 | check for identity |
! | not $a | negation (unary) |
% | $a mod $b | modulous |
is [not] div by | $a is not div by 4 | divisible by |
is [not] even | $a is not even | [not] an even number (unary) |
is [not] even by | $a is not even by $b | grouping level [not] even |
is [not] odd | $a is not odd | [not] an odd number (unary) |
is [not] odd by | $a is not odd by $b | [not] an odd grouping |
Example {if} statements
{if $name eq 'Fred'}
Welcome Sir.
{elseif $name eq 'Wilma'}
Welcome Ma'am.
{else}
Welcome, whatever you are.
{/if}
{* an example with "or" logic *}
{if $name eq 'Fred' or $name eq 'Wilma'}
...
{/if}
{* same as above *}
{if $name == 'Fred' || $name == 'Wilma'}
...
{/if}
{* parenthesis are allowed *}
{if ( $amount < 0 or $amount > 1000 ) and $volume >= #minVolAmt#}
...
{/if}
{* check for not null. *}
{if isset($foo) }
.....
{/if}
{* test if values are even or odd *}
{if $var is even}
...
{/if}
{if $var is odd}
...
{/if}
{if $var is not odd}
...
{/if}
{* test if var is divisible by 4 *}
{if $var is div by 4}
...
{/if}
{*
test if var is even, grouped by two. i.e.,
0=even, 1=even, 2=odd, 3=odd, 4=even, 5=even, etc.*}
{if $var is even by 2}
...
{/if}
{* 0=even, 1=even, 2=even, 3=odd, 4=odd, 5=odd, etc. *}
{if $var is even by 3}
...
{/if}
{while}
{while} is similar to {if} and takes the same set of modifiers.
Every {while} must be paired with a matching {/while}.
Example {while} loop
{while $foo > 0}
{$foo--}
{/while}
The above example will count down the value of $foo until 1 is reached.
Attributes
Most of the functions take attributes that specify or modify their behavior. Attributes to Smarty functions are much like HTML attributes. Static values don't have to be enclosed in quotes, but it is required for literal strings. Variables with or without modifiers may also be used, and should not be in quotes.
Some attributes require boolean values (TRUE or FALSE). These can be specified as true and false. If an attribute has no value assigned it gets the default boolean value of true.
Example:
{assign var=foo value={counter}}
Loops
Loop (repeat) sets of data with the {foreach} syntax.
Conditionals
Conditional statements have the typical if/else structure:
{if $test == "1"}Yes!{else}No!{/if}.
Alternatively:
elseif: {if $person == "Mike"}You are Mike{elseif $person == "Paul"}You are Paul{else}You are neither Mike nor Paul. Who are you?{/if}.
Variable Modifiers
Variable modifiers can be applied to variables, custom functions or strings. To apply a modifier, specify the value followed by a | (pipe) and the modifier name. A modifier may accept additional parameters that affect its behaviour. These parameters follow the modifier name and are separated by a : (colon). Also, all PHP-functions can be used as modifiers implicitly (more below) and modifiers can be combined.
Examples are:
{* apply modifier to a variable *}
{$title|upper}
{* modifier with parameters *}
{$title|truncate:40:"..."}
{* apply modifier to a function parameter *}
{html_table loop=$myvar|upper}
{* with parameters *}
{html_table loop=$myvar|truncate:40:"..."}
{* apply modifier to literal string *}
{"foobar"|upper}
{* using date_format to format the current date *}
{$smarty.now|date_format:"%Y/%m/%d"}
Modifiers
Modifiers allow you to quickly manipulate data to improve its appearance. Here is a concrete example. Let's say that your Books database has grown very large. Lots of different people have entered data, and you have imported data from many different sources. You aren't sure if all the titles of all the books are capitalised consistently. When you display the title of a Book record in your custom report, you can make sure that it is capitalised consistently by using the 'capitalize' modifier like so:
<p>Book Title: {$r.f1|capitalize}</p>
{* Data in the database: 'the history of Tom Jones, a Foundling. In four volumes.' *}
Book Title: The History Of Tom Jones, A Foundling. In Four Volumes
As you can see, to apply a modifier, simply type the pipe "|" character after the data, and then type the name of the modifier you wish to use.
It is possible to use multiple modifiers at once, and also to change their behaviour. For example, your Books database may contain many long titles, as well as many titles that are not capitalised correctly. You can easily shorten ('truncate') the tiles as well as capitalising them like so:
<p>Book Title: {$r.f1|capitalize|truncate:25}</p>
{* Data in the database: 'the history of Tom Jones, a Foundling. In four volumes.' *}
Book Title: The History Of Tom Jones,...
As you can see, to use another modifier, you can simply type another pipe "|", and put the name of the next modifier after it. If the modifier needs you to specify some settings, you can do this with a colon ":". In this case, you can tell 'truncate' how many characters to keep. By typing :25, you tell the modifier to keep just the first 25 characters of each book title. The modifier automatically adds the ellipsis characer (...) if a word is too long and gets truncated.
There is a complete list of modifiers on the SMARTY website.
The Wrap Function
Inserting text or numerical data into a Heurist Custom Report is easy. It is more complex to insert an image, video, audio file or location data. As a recap, consider the below code:
<p>Name: {$r.f1}</p>
This code will create a new paragraph ( **<p></p> **), which will begin with "Name: " and then with the text from Field 1 ( **f1 **) in the relevant record ( **$r **).
But what if the data you have is an image or audio file? Imagine that your custom report displays records about Persons, and you have made a recording of each Persons's voice, stored in Field 1000. You could try the following code, but it would not do the job:
<p>Voice Recording: {$r.f1000}</p>
You might hope that this would provide a link or some other fuctionality, but instead, when users visit your website, they would see this:
Voice Recording: https://heuristref.net/h6-alpha/?db=example_db&file=68e8f8ce906d1ad44eb70e97ba2b37b10cb80223
To help you with situations like this, we provide the 'wrap' function. The following code would work perfectly:
<p>Voice Recording: {wrap var=$r.f1000_originalvalue dt="file" auto_play="0"}</p>
Voice Recording: 
The wrap function works with images, audio files, video files and also with simple links.
If you wish users to be able to zoom in on an image or video, then you can add a 'fancybox'. To do this, add **mode **and **fancybox **parameters to the wrap:
{wrap var=$r.f438_originalvalue dt="file" mode="thumbnail" fancybox="1" auto_play="0"}
If $r.f438 is an image, video, pdf or similar, viewers of the custom report will now be able to click on it to zoom in and explore details.
**NB: **The 'thumbnail' parameter is necessary for *videos *and *pdfs *, if you wish these to be clickable and zoomable. If you forget to write mode="thumbnail" for an image there will be no problem.
You don't need to remember how to write the 'wrap' function. When you use the wizard to insert a field into your custom report, simply choose the ' **Field + function wrapper **' option before clicking ' **Insert field value **', and the 'wrap' function will be included for you automatically.

For dates
For custom reports the wrap function allows selection of the level of detail output for dates and what calendar to use:
{wrap var=$r.f9_originalvalue dt="date" mode="1" calendar="both"}
{*Date mode: 0-simple,1-full, 2-all fields; calendar: native, gregorian, both *}
{$r.f9} is equivalent to {wrap var=$r.f9_originalvalue dt="date" mode="0" calendar="native"}
html text fields with relative paths
- Images from WYSYWIG/tinymce text field are not displayed in custom reports. Relative url may be the cause ?
https://dicobiosport.huma-num.fr/heurist/viewers/smarty/showReps.php?db=dicobiosport&q=id:76424&template=Record.tpl
For such cases use the internal “wrap” function that converts all relative paths to absolute ones
{$txt=$r.f954|regex_replace:"/\r*\n+/":"</p><p>"}
<p>{wrap var=$txt}{*Biographie*}</p>
Calculated fields
Calculated fields are updated on add/save (including other records that are in list of affected record types cfn_RecTypeIDs). . Calculated fields are updated before update of record title.
Calculate fields are not updated on record import. You will need to rebuild calcualted fields after import with Admin > Rebuild calculation fields
- Configure a ‘Weekday’ dropdown for the Mary Hamilton Project. A simple vocabulary of the seven days of the week, then defined this formula for the field:
{$date = $r.f9} {$date->format(‘l’)}
{date_format(date_create($r.f9),"l")} - for weekday as word
{10630+date_format(date_create($r.f9),"N")} - for weekday as enum value
Bootstrap
Bootstrap is now incorporated as components in website format Vsn 3, but for older websites this may be useful.
Is there a way of using Boostrap without messing up the CMS?
CSS is not enough. Bootstrap is javascript library and affects all elements besides css. It creates its own widgets for buttons, inputs etc. Fortunately since v5 it is jquery free otherwise v4 may load its own jquery jquery-3.3.1 and it conflicts with ours
OK. There is $.fn.button.noConflict(); in bootstrap that resets the appropriate element to original mode.
Manual rendering of file fields
You may encounter situations in which the 'wrap' function does not behave as you would wish. In such a situation, you can manually control how the file field is rendered. Click below for details.
Manually accessing data in file fields:
A common application of this is to include information from the description of an uploaded file in the Custom Report. For example, when uploading an image, you might include image credits in the description of the file, or a caption to be displayed, or alt text for screen readers. To include this data in your custom report, you would use the 'ulf_Description' key, like so:
{$r.f38_originalvalue[0]['ulf_Description']}
Linked and Related Records
There are different ways that Heurist records can be linked to one another. In the simplest case, a record can have a 'record pointer' field, which simply points to another record. For example, a book may have an author field. Rather than containing a name, the 'author' field simply contains the id number of the Person who is the author of the book.
Using Record Pointers in the Current Record
When writing a custom report, it is easy to insert records that the current record points to, simply by using the field browser on the left of the screen. Simply choose which information you would like to include from the linked record, and use the 'insert field' tool. Heurist will insert some code that looks a bit like this:
{$f1000=$heurist->getRecord($r.f1000)}
Here is a detailed breakdown of the code:
- $f1000 ☚ The variable where you will store information about the new record. Heurist will give it a default name based on how the information is stored in the database. In this example, the book's author is stored in Field 1000, so $f1000 is used. You could change this to $author to make your code easier to read
- $heurist->getRecord ☚ Retrieve authors information from the database
- $r.f1000 ☚ The author's ID number, which is stored in Field 1000 of the book record. As the main record type in the Custom Report, the book has simply been labelled $r.
If the field is repeatable, then you should click the 'repeatable' link in the field selector tool, which will insert code that looks something like this:
{foreach $r.f1000s as $f1000 name=valueloop}
{$f1000=$heurist->getRecord($f1000)}
{* Do something with each $f1000 (i.e. author in this example *}
{/foreach}
This is very similar to the above code, except that there is a foreach loop, and instead of asking for the information in $r.f1000, you request information in $r.f1000s, the plural form.
Linked Records
The situation is more complex, however, if you wish to fetch information from *other *records that point to *this *one. For instance, suppose you want to display information about a Book. Part of the information you wish to display is information about the libraries that hold this Book. But in your database, information about library holdings is held in the Library record type. For instance, if you open up the 'New York Public Library' record, and look in the 'Books Held' field, you will see a list of all the books held by that library. When it comes time to display information about a particular book in a custom report, how can you retrieve information about all the Libraries that hold that book?
To solve this problem, Heurist provides the getLinkedRecords method. The code snippet below would retrieve a list of every library that holds the current book, and then put the name of each library into a bullet-point list:
<p>Libraries holding this book:</p>
<ul>
{$libraries = $heurist->getLinkedRecords($r.recID, 25, 'linkedfrom')}
{foreach $libraries['linkedfrom'] as $library}
<li>
{$library_details = $heurist->getRecord($library)}
{$library_details.f1}
</li>
{/foreach}
</ul>
Feel free to copy that code into your own Custom Report and make appropriate modifications. Here is a line-by-line breakdown of the code:
- <p>Libraries holding this book:</p> ☚ This creates a heading for the list of libraries. You could also use a subheading element such as <h2> or <h3>
- <ul> ☚ This tag begins the bullet point list. Every item inside it will be included in the list. Every such item should be enclosed in <li> tags.
- {$libraries = $heurist->getLinkedRecords($r.recID, 55, 'linkedfrom')} ☚ This line fetches information about all the libraries linked to the current book. Here is a more detailed breakdown:
- $libraries ☚ The name of the variable where you will store all the libraries' ID numbers
- $heurist->getLinkedRecords ☚ The method for finding linked records, which is stored inside the $heurist object
- $r.recID ☚ The record ID of the current record you are looking at, which is assumed to be a book for this example
- 55 ☚ The RecordTypeID for the 'Library' type in this database. By putting this 55 here, you are telling Heurist only to look for *Libraries *that point to this book, as opposed to *Bookshops *or *Persons *or any other record type that may also point to Books in your database. To find the Record Type ID for a particular record, go to the Record Types tool in the Design Menu . If you don't provide a number, then Heurist will simply retrieve every record connected to this one. If you wish to search for multiple record types, you can provide an array in square brackets, e.g. [55, 66, 81].
- 'linkedfrom' ☚ This tells Heurist only to look for records that *point to *Books (i.e. to find records that this Book is *linked from *). You can also ask Heurist to find all records 'linkedto' this record. If you don't provide Heurist this clue, then it will simple find all records linked to this Book, whether it is the other record that points to the book, or the book that points to the other record.
- {foreach $libraries['linkedfrom'] as $library} ☚ Loop over each library that this book is linked from, and do something each time
- <li> ☚ Create a new bullet point
- {$library_details = $heurist->getRecord($library)} ☚ Retrieve the current library's details
- {$library_details.f1} ☚ Put the library's name in the bullet point
- </li> ☚ The bullet point is now finished
- {/foreach} ☚ That is all we want to do with this library – now go back to the start of the 'foreach' loop and do the same again for the next library, until all a dealt with
- </ul> ☚ After creating a bullet point for each library, close the list.
Related Records
A similar problem is posed by Record Relationships. These are complex interrelationships between records, and are not actually stored in the records themselves. Instead, there is a seperate table in the underlying database, which stories information about every Record Relationship. If you wish to retrieve this relationship data, we provide the $heurist->getRelatedRecords method. Let's say you are building a new custom report, displaying information about authors in your Books database. If you wished to display information about an author's relatives, you could write:
This example is very similar to the getLinkedRecords example, so I will just pick out a few details that are different:
- {$relatives = $heurist->getRelatedRecords($r)} ☚ This fetches every record that is directly related to this record ($r), and stores the information in a new array called $relatives.
- {foreach $relatives as $relative} ☚ Now we loop over the array, to create a bullet point for each relative
- {$relative.recRelationType} ☚ All relationships have a RelationType, e.g. 'isMotherOf' or 'wasParticipantIn'. You can retrieve this information with .recRelationType
- {$relative.f1} ☚ Assuming that the $relative is a Person, this would insert their surname into the report
- {$relative.recRelationType} : {$relative.f1} ☚ Taken together, this would insert the type of relationship, a colon and then the surname of the relative into the report, e.g. isMotherOf : Smith.
**NB: **As you can see, there is no need to use $heurist->getRecord when using the $heurist->getRelatedRecords method. This method returns *all *the information about each related record, not just the record ID of each relative. Contrast this with the above examples of Record Pointers and Linked Records.
Examples
- I want to use the title (or the family name) of the Person who was interviewed to insert in the Interview extract (Extract is child of interview is child of person). Interview has a pointer to Person that has a title (Family Name = field #1), so you first need to load the person record, then you can access the family name or other fields in Person.
{$person=$heurist->getRecord($f247.f15)} {* Person *}
{$person.f1} {*Family name *}
- How do you retrieve fields from the relationship record (as well as the related record). getRelatedRecords returns an array of related records with additional header fields: recRelationType*, recRelationNotes, recRelationStartDate, recRelationEndDate.
{$rel_record = $heurist->getRecord($Relationship.recRelationID)}
{$src_info = $heurist->getRecord($rel_record.f1160)}
Source de l'Information: {$src_info.recTitle}
{* Get infromation from the relationship record *}
{$rel_record = $heurist->getRecord($Relationship.recRelationID)}
{$src_info = $heurist->getRecord($rel_record.f1160)}
Source de l'Information: {$src_info.recTitle}
Start Date: {$rel_record.f10}
End Date: {$rel_record.f11}

Sorting related records
In smarty reports, when dealing with a {foreach} loop calling child records, you may need to order the resulting set based on a specific variable/field from the child record eg. producing a list of child records ordered alphabetically by author.
{* Bibliographic references *}
{if ($r.f1016s)}
{$bibs=array()}
{foreach $r.f1016s as $bibRef name=bibLoop}
{$reference=$heurist->getRecord($bibRef)}
{$bibs[$reference.recID] = $reference.recTitle}
{/foreach}
{capture}{asort($bibs)}{/capture}
<section class="references">
<p><strong>Bibliographical References:</strong></p>
<ul>
{foreach $bibs as $bib_id=>$bib_title name=bibLoop2}
<li>{$bib_title}
<a href=https://Heurist.Huma-Num.fr/judaism_and_rome/view/{$bib_id}
target=_blank>view</a></li>
{/foreach}
</ul>
</section>
{/if}
V2 - > r in second for loop can be used in the same way as in any other for loops of records
$repeatsorted=array()}
{foreach $repeat as $item name=valueloop}{* *}
{$item=$heurist->getRecord($item)}
{$repeatsorted[$item.recID] = $item.recTitle}
{/foreach}
{capture}{asort($repeatsorted)}{/capture}
{foreach $repeatsorted as $itemsorted name=valueloop}{* *}
{$r=$heurist->getRecord($itemsorted@key)}
{/foreach
***To get info from the relationship record ***
(I've added this to z_Ian_Text report):
Use h6-alpha
{* Get infromation from the relationship record *}
{$rel_record = $heurist->getRecord($Relationship.recRelationID)}
{$src_info = $heurist->getRecord($rel_record.f1160)}
Source de l'Information: {$src_info.recTitle}
Start Date: {$rel_record.f10}
End Date: {$rel_record.f11}
I have put in rubbish dates 1111 and 9999

Note that when using getRelatedRecords and getLinkedRecords, it is not possible to detect what relationship marker field generated the particular relationship. We don't keep this info. You may filter out the required record by rectype and relation type
Detecting if a linked record is visible to public
- Detection, in a custom report, whether a linked record is visible to the public
**{foreach $r.f1107s as $f1107 name=valueloop}{\* Other sources \*}**
  	**{$source=$heurist-\>getRecord($f1107)}**
  **{if ($source.recNonOwnerVisibility=='public')}**
or: {if ($source.recIsVisible!==false)} {* Hide non-public related sources if not logged in *}
Advanced HTML, CSS and JavaScript
To unlock the full power of the Custom Report tool, you need to have CSS and JavaScript enabled for your database. To do this, please contact your server administrator. On the Sydney and Huma-Num servers, the administrator is ian.johnson@sydney.edu.au . If you are using a hosted version of Heurist at another institution, you will need to inquire there about who has adminstrative rights.
Along with HTML, JavaScript and CSS are the building blocks of the web. JavaScript is a fully-featured programming language with inbuilt tools for interacting with web pages through the Document Object Model (the DOM). CSS (or 'Cascading Style Sheets') is a simple formatting language that allows you to describe how you would like different page elements to be formatted.
There are many ways you can embed JavaScript and CSS into a Heurist website. For a full discussion, please visit the JavaScript and CSS pages of this help system.
Once you have enabled JavaScript and CSS, you can structure your reports using more advanced features.
Note that the custom JS and CSS defined at the site or page level (in CMS Home or CMS Menu_page) are not applied to custom reports. You must add the needed CSS and JS code directly in the report.
Note that you will not be able to use php code and functions within smarty on Heurist. Most php functions have been restricted for security issue. Please contact the Heurist development team should you need to use php code.
Using Advanced HTML Elements
By default, you are able to use the following tags to structure your Custom Report:
- <h1> - <h6> for headings
- <p> for paragraphs
- <a> for links
- <ul> for bullet points and <ol> for numbered lists, along with the crucial <li> tag for each item in the list
- <span> for spans (e.g. for highlighting particular text)
- <strong> for making text bold, and <em> for italicising it
- <div> for divisions
- <table> for tables. There are many other tags that need to be used to make tables work. The most important are <th> , <tr> and <td> , which allow you to define table headings, rows and datapoints. Click though the link to see information about other more advanced features of html tables.
- <img> , <audio> and <video> elements introduced using the Wrap Function .
Once you have enabled JavaScript and CSS, however, you can consider using more advanced HTML tags to structure your report. Some of these elements include:
- <article> – This element is ideal for wrapping a single result. For instance, if your custom report will output a list of Persons, the results for each Person will be inside an <article> element. This helps screen readers and search engines interpret the structure of your page. NB: Each article should have exactly one <h1> element inside it, for the 'title' of the article.
- <section> – Divisions are arbitrary elements, than can serve any number of roles. If you wish to deliberatly divide the content of your report into sections, then the section tag can be a good choice.
- <details> – Using a details element, you can easily create collapsible elements on your page. To change the animation of the element, you will need to use CSS.
- <dl> – A 'description list' provides a natural way to display labelled data. For example, if you wish to elegantly display the name, age and birthplace of a person, then a description list can provide a simple solution.
Enabling JavaScript and CSS
Additional styling from the website’s home page is also added to the custom report, if allowed.
J’ai créé un custom report avec du JS/Jquery (qui a été activé - base SF_ScriptaManent_Dev).
Il comprend surtout des petites fonctions qui permettent par exemple de montrer/cacher des sections au clic sur un bouton
Tout se passe bien quand j’affiche mes résultats en mode inline (voir capture) – le JS et le CSS sont bien pris en compte.
Par contre, si je demande l’affichage sous forme de modale, le JS et le CSS ne sont plus du tout pris en compte. J'ai le même problème lorsque je clique sur un lien pour aller sur un autre fiche en relation, peu importe le mode d'affichage (sur une nouvelle page ou dans une modale).
One of THE most powerful features of Heurist is the ability to modify record structures – not just the fields being
J’ai essayé de placer mes fonctions JS au niveau du site et non du custom report, mais ça ne change rien et je ne vois pas comment résoudre ce problème. Le custom report est bien appliqué mais toute sa mise en forme n’est pas prise en compte et j'obtiens donc un affichage brut. En pièce jointe une section exemple avec le JS/CSS actifs en inline et la version non customisée sur tout autre mode de visualisation.
----------
Merci pour votre réponse. J'ai l'impression que c'est bien le JS + le CSS qui ne sont pas pris en compte, puisque ce sont des classes CSS qui me permettent d'avoir des résultats sur 2 colonnes.
showReps.php - smarty report page runs without loading/initialization nearly all javascripts libraries. If you need to use jquery in your reports - define them explicitly in header of smarty template. I’ve added it
<html>
<head>
<script src="https://code.jquery.com/jquery-1.12.2.min.js" integrity="sha256-lZFHibXzMHo3GGeehn1hudTAP3Sc0uKXBXAzHX1sjtk=" crossorigin="anonymous"></script>
<script src="https://code.jquery.com/ui/1.12.1/jquery-ui.min.js" integrity="sha256-VazP97ZCwtekAsvgPBSUwPFKdrwD3unUfSGVYrahUqU=" crossorigin="anonymous"></script>
<link rel="stylesheet" type="text/css" href="https://code.jquery.com/ui/1.12.1/themes/base/jquery-ui.css" />
<script>
Merci beaucoup, ça marche. J'ai aussi dû ajouter le CSS dans le header pour qu'il soit pris en compte en dehors de la visualisation en inline.
Du coup, ça a également répondu à une autre question que j'avais, qui était comment ajouter bootstrap au projet.
Where to place your CSS
We recommend placing your custom CSS at the top of the report wrapped within style tags.
Embedding Custom CSS
To embed CSS in your custom report, you can introduce <style> tags in the head of the report. These should ideally be enclosed in a {literal} command so that the SMARTY engine will not get confused (in fact, it only rarely gets confused, but you should make sure anyway).
If you like, you can copy-and-paste the below code snippet into your report, immediately below the first <html> tag at the top of the template:
<head>
{literal}
<style>
/* Place all custom styles here */
</style>
{/literal}
</head>
You can also embed CSS in individual elements in your report. For example, the below code will center a paragraph and turn the text yellow:
<p style="text-align: center; color: red;">This paragraph is now centered and coloured red.</p>
This paragraph is now centered and coloured red.
Since 'inline styling' can seem convenient, but in the long run it is better if you place all the styling infoormation in one place, and control it as an integrated whole. For a deeper introduction to CSS, please see our CSS page.
Embedding Custom JavaScript
To embed JavaScript in a custom report, you can use a <script> tag. This can be a tricky task. Generally speaking, when you are getting started with JavaScript it is a good idea to place the <script> tag at the end of your report. The reason for this is that you don't want the user's browser to execute the JavaScript before all the other parts of the report have loaded. If you place the <script> tag at the *start *of your report, then the user's web browser may try to execute all the JavaScript before the rest of the report is ready. It might try to change the colour or size of a particular image or paragraph, but the image or paragraph has not been loaded yet. This will cause an error and probably prevent the JavaScript from working.
If you wish to embed some JavaScript in your page, you can copy-and-paste the below code snippet, and place it at the end of your report, just above the final <html> tag:
<script>
{literal}
// Place all JavaScript here
{/literal}
</script>
For a fuller introduction to using JavaScript in a Heurist website, visit our JavaScript page.
JQuery in reports
showReps.php - smarty report page runs without loading/initialization nearly all javascripts libraries. If you need to use jquery in your reports - define them explicitly in header of smarty template. I’ve added it
<html>
<head>
<script src="https://code.jquery.com/jquery-1.12.2.min.js" integrity="sha256-lZFHibXzMHo3GGeehn1hudTAP3Sc0uKXBXAzHX1sjtk=" crossorigin="anonymous"></script>
<script src="https://code.jquery.com/ui/1.12.1/jquery-ui.min.js" integrity="sha256-VazP97ZCwtekAsvgPBSUwPFKdrwD3unUfSGVYrahUqU=" crossorigin="anonymous"></script>
<link rel="stylesheet" type="text/css" href="https://code.jquery.com/ui/1.12.1/themes/base/jquery-ui.css" />
<script>
Adding Javascript
Heurist sanitises content to remove javascript which users might have inserted in html, for security reasons.
If you need to use Javascript in your web pages, please ask you server manager to enable it
by listing the name of the database in ..../HEURIST/js_in_database_authorised.txt on the server.
Example:
// Sep 2019: This file lists databases on this server which may include JS code in the CMS Home Page or CMS Menu records
// All other databases are excluded from executing such code. Order is unimportant.
balipaintings
johns_hamburg
ExpertNation
etc.
Note:
To add Javascript to a web page you need to put it in the special Javascript field in Website Header / Layout
Javascript embedded directly in the page will be filtered out even if it is authorised through the js_in_database_authorised.txt file.
Where to put your JavaScript
We recommend placing your custom JavaScript at the top of the report wrapped within script tags.
If the JavaScript is situational or requires a specific HTML element, e.g. a button or link, then place the JavaScript within script tags at the end of the report or after the specific HTML element.
Server path and database name
You can reference the server path and the database name in a smarty report as follows (in blue):
<a href="{$heurist->constant("HEURIST_BASE_URL")}/heurist/hclient/framecontent/recordEdit.php
?db={$heurist->constant("HEURIST_DB")}&recID={$r.recID}" target=_blank>{$r.recTitle}</a>
Op wo 18 sep. 2019 om 14:26 schreef Artem Osmakov <osmakov@gmail.com>:
Record URL
the recURL property seems to return nothing on anything I tried it on ({$r.recURL}, {$Relationship.recURL}, {$r.Relationship.recURL})
recURL is special header field. It becomes visible if mark "Show record URL on edit form:" in record type attribute window.
In case you wish to specify url for specific record
https://heuristref.net/h6-alpha/?db=johns_hamburg&fmt=html&recid={$r.recID}
- whereas, in a for loop, {$Relationship.recTitle} works, {$Relationship.recRelationType} doesn't work (i.e., it does not seem to return anything). On the other hand, outside a for loop, {$r.Relationship.recRelationType} does work.
In addition, I still do not know how to access the Person record from an Event in the Report editor. Persons are connected to Events through Actor entities. I can access the Actor through the "Relationship", but I do not know how I can access the Person linked to this Actor. In particular, I'd like to add the URL of the Person, not the Actor, to the report.
No need in {$Relationship=$heurist->getRecord($Relationship)}. each entry in Relationships array is already a record.
I've modified your report. Persons are linked to Actors. Thus need to use getLinkedRecords.
This method has 3 parameters
$rec - record id or record array - record to find records linked to or from this record
$rtyt_ID - record type or array of record type to filter output
$direction - linkedfrom or linkedto or null to return both direcctions
method returns array of record IDs devided to 2 arrays "linkedto" and "linkedfrom"
<br/>Actors involved in this event:
<ul>
{foreach $r.Relationships as $Actor name=valueloop}{* Relationship Events->Actors *}
<li>{$Actor.recID} {$Relationship.recTitle} (url:{$Actor.recURL}) (reltype:{$Actor.recRelationType})
{* PV: How to make this refer to Person not Actor? *}
{$Persons = $heurist->getLinkedRecords($Actor, 10, 'linkedfrom')}
{$Persons = $Persons.linkedfrom}
{foreach $Persons as $Person_ID name=valueloop2}{* Link Actor->Person *}
{$Person=$heurist->getRecord($Person_ID)}
<br>Person: {$Person.recID} {$Person.recTitle}
{/foreach}{* Person *}
</li>
{/foreach}{* Actors *}
</ul>
Images
Multiple images in a smarty report
$r.f8_originalvalue - is array with full info about images (names, size, ids)
$r.f8 - is just an url to an image. Or comma separated list of urls. Like:
https://heuristref.net/h6-alpha/?db=balipaintings&file=f0b08e2d6742e01315cc4adb1255dc8f712ea573,https://heuristref.net/h6-alpha/?db=balipaintings&file=a28c126e2d7b23844f8fd06e9df659a6789f8d34
Thus, to access image urls you have either split $r.f8 to array
{$images = explode(',',$r.f8)}
{foreach from=($images) item=$s name=images}
<div class="scrollimage"><img src="{$s}"/></div>
{/foreach}
Or access image ids from $r.f8_originalvalue.
{foreach from=($r.f8_originalvalue) item=$s name=images}
<div class="scrollimage"><img src="https://heuristref.net/h6-alpha/?db=balipaintings&file={$s['ulf_ObfuscatedFileID']}"/></div>
{/foreach}
I believe the latter is reliable.
See Bali Paintings: test_art report. It has 3 options for file field
{$r.f8}{*Images (full Resolution)*}
<br>
{wrap var=$r.f8_originalvalue dt="file" width="300" height="auto"}{*Images (full Resolution)*}
<br>
{print_r($r.f8_originalvalue,true)}
First one returns comma separated list of file urls.
Second one generates 2 img tags for this field
Third options provides you full access to file data. $r.f8_originalvalue - is array that has all file properties
Array ( [0] => Array ( [ulf_ID] => 35448 [fullPath] => resources/haks/336a.jpg [ulf_ExternalFileReference] => [fxm_MimeType] => image/jpeg [ulf_Parameters] => mediatype=image [ulf_OrigFileName] => 336a.jpg [ulf_FileSizeKB] => 1203 [ulf_ObfuscatedFileID] => 04310a4cfd6883d63eda46e50021b36011f8912a [ulf_Description] => [ulf_Added] => 2015-03-13 16:05:48 ) [1] => Array ( [ulf_ID] => 43315 [fullPath] => resources/earlyFiles/Haks336.jpg [ulf_ExternalFileReference] => [fxm_MimeType] => image/jpeg [ulf_Parameters] => mediatype=image [ulf_OrigFileName] => Haks336.jpg [ulf_FileSizeKB] => 196 [ulf_ObfuscatedFileID] => 36a8179bd143e2e26fd42e6ae13bf66f5fef4b77 [ulf_Description] => [ulf_Added] => 2016-11-08 21:13:08 ) )
Mirador
Load mirador viewer into an iframe within a smarty report:
{wrap var=$r.f38_originalvalue dt="file" height="640" width="800"}
Show thumbnail and open mirador viewer in popup (if heurist is detected) or in new tab:
{wrap var=$r.f38_originalvalue dt="file" height="auto" width="300" mode="thumbnail" fancybox="1"}
Question: How does Herist know that an IIF Manifest is a manifest rather than just any old JSon file? (in fact it currently treats it as the latter in custom reports)
We can register either info.json (reference to local or remote IIIF server that describes particular IIIF image) or manifest.json (that describes set of media and their appearance).
On registration if mime type is application/json we loads this file and check whether it is image info or manifest. For former case we store in ulf_OrigFileName “iiif_image”, for latter one “iiif”.
Dominique Stutzman:
I confirm, the integration of a iiif manifest URL in a "File" type field works fine; sometimes you have to change the MIME type to application/json.
Then a question: is it possible to import this particular type of "File(s)" in mass in the "Populate" menu?
In the individually added data, which is used to generate the thumbnail and the call to the Mirador widget, we have the following metadata:
<origName>_iiif</origName>
<mimeType>application/json</mimeType>
<origName>_remote</origName>
<mimeType>application/json</mimeType>
sometimes
<mimeType>text/html</mimeType>
IIIF
I've tested the method for displaying a viewer in a report and it works for an IIIF image. However, I couldn't get it to work for an IIIF manifest. I imagine there are some small changes to be made, could you tell me what they are? I need to display a manifest in the registry.tpl template.
Artem says, in blue:
(please let me know if you have any problem, and which one you used in the end, as it will be useful documentation):
There are 3 ways
- Via wrap function (preferred)
{wrap var=$r.f1200_originalvalue dt="file" width="1200" height="800"}<br/>
2) Via direct manifest URL
<iframe width=1200 height=800 src="https://heurist.huma-num.fr/h6-alpha/hclient/widgets/viewers/miradorViewer.php?db=pret19_test&recID=&url={urldecode($r.f1200)}"></iframe>
3) Via file obfuscation ID {$r.f1200_originalvalue[0].ulf_ObfuscatedFileID}
<iframe width=1200 height=800 src="https://heurist.huma-num.fr/h6-alpha/hclient/widgets/viewers/miradorViewer.php?db=pret19_test&iiif={$r.f1200_originalvalue[0].ulf_ObfuscatedFileID}"></iframe>
Embedding Mirador for IIIF images
- t should work with this way
{wrap var=$f1135.f1097_originalvalue dt="file" width="1200" height="800"}
However, since media is not registered as iiif manifest it shows it as a plain jpg image.
So there is another way:
{assign var='img_id' value=$f1135.f1097_originalvalue.0.ulf_ObfuscatedFileID}
<br>Obfuscation ID: {$img_id}
<iframe width=1200 height=800 src="https://heurist.huma-num.fr/heurist/hclient/widgets/viewers/miradorViewer.php?db=pret19_test&rec_ID=&iiif_image={$img_id}"></iframe>
-----------------------
- ..miradorViewer.php?db=dbname&iiif_image=d252a3fe145f0f9a5514a01688454ee36d20773d
shows this media only. ..miradorViewer.php?db=dbname&q=ids:123 shows all media for record
Using OpenSeaDragon in a custom report/website
J'ai installé une petite visionneuse (OpenSeadragon) dans un customreport sur https://heurist.huma-num.fr/h6-alpha/?db=GrandFichier_RB, report name OSD, pour zoomer de façon immersive dans une image. Cette "image" est la numérisation d'une archive déposée dans la base Heurist que j'appelle depuis un record nommé "fiche".
Exemple ici de ce que j'aimerais que ça donne :
https://codepen.io/Mathieu-Messager/pen/oggXOBV
Voici mon bout de code sous le Smarty embarqué dans Heurist, corrected for multiple images by Maël Le Noc :
<div class="offcanvas-body small">
<!-- VISIONNEUSE OpenSeaDragon-->
<div id="openseadragon"></div>
<script>
var viewer = OpenSeadragon({
element: "openseadragon",
prefixUrl: "https://openseadragon.github.io/openseadragon/images/",
tileSources:
[
{foreach $r.f1071_originalvalue as $fid name=valueloop}
{
type: "image",
url:" https://heurist.huma-num.fr/heurist/?db=GrandFichier_RB&file={$fid.ulf_ObfuscatedFileID} " {*numérisation de la fiche*}
},
{/foreach}
],
collectionMode: true,
sequenceMode: true,
showNavigator: true,
});
\</script\>
\</div\>
Displaying multiple files
MF: In Custom Reports when a field of base type ‘file’ is repeatable, rather than returning an array, $heurist->getRecord returns a string.
Moreover, it returns a list of heurist URLs even If the files are external links. In Vincent’s example below, all the images are hosted externally, but when you get the URL of the image in the Custom Report, you receive a Heurist URL with ?file=XXXXXX. Is this intentional? The behaviour when a file field is *not *repeatable is quite different – you receive the URL for the external file.
------
AO: If you add {print_r($r, true)} to you smarty you will see the output. For file fields we have 2 entries
fXXX - is just a string with comma separated urls and fXXX_originalvalue contains array with ALL fields. If you prefer use external url
{$r.f39_originalvalue[0]['ulf_ExternalFileReference']}
[f39] => http://127.0.0.1/h6-ao/?db=osmak_9b&file=884071c151ae247f9b6912f5e6b5b3df5853a770, http://127.0.0.1/h6-ao/?db=osmak_9b&file=31a7dca1c9e146f1e5c4213e89beba9ec9690926
[f39_originalvalue] => Array (
[0] => Array (
[ulf_ID] => 89
[fullPath] => file_uploads/ulf_89_IMG-ed49a7c0b77925453b7b83640ceee026-V.jpg
[ulf_ExternalFileReference] =>
[fxm_MimeType] => image/jpeg
[ulf_Parameters] =>
[ulf_OrigFileName] => IMG-ed49a7c0b77925453b7b83640ceee026-V.jpg
[ulf_FileSizeKB] => 168
[ulf_ObfuscatedFileID] => 884071c151ae247f9b6912f5e6b5b3df5853a770
[ulf_Description] => [ulf_Added] => 2022-02-11 15:46:02 [ulf_MimeExt] => jpg )
[1] => Array ( [ulf_ID] => 90 [fullPath] => file_uploads/ulf_90_IMG-a3807536a83651e2bd50e88424858586-V.jpg [ulf_ExternalFileReference] => [fxm_MimeType] => image/jpeg [ulf_Parameters] => [ulf_OrigFileName] => IMG-a3807536a83651e2bd50e88424858586-V.jpg [ulf_FileSizeKB] => 81 [ulf_ObfuscatedFileID] => 31a7dca1c9e146f1e5c4213e89beba9ec9690926 [ulf_Description] => [ulf_Added] => 2022-02-11 15:46:14 [ulf_MimeExt] => jpg ) )
Besides use wrap function to output image, video or audio player
{wrap var=$r.f39_originalvalue dt="file" width="300" height="auto"}
Moreover, "wrap" function outputs ALL images. So, I've added
{wrap var=$f1145.f1122_originalvalue dt="file" width="600" height="auto" auto_play="0" show_artwork="0"}
inside "liasse" loop
./viewers/smarty/showReps.php?db=leand_khmerman&w=a&q=ids%3A2467&publish=1&debug=0&template=manuscript%20details.tpl
If you wish to treat images just add another loop for array $f1145.f1122_originalvalue
Image carousel
Note: JS must be enabled by your system adminstrator for your database (an entry in the permit javascript file in the HEURIST root directory)
An image carousel can be added to a page in a website by placing suitable JS code in the custom JS field, as shown below.
See also https://www.w3schools.com/css/css_image_gallery.asp for an alrernative CSS method.

//image gallery on home page
var gallery = $('#image-gallery');
if(gallery.length>0){
var images = [
{"title":"Arch of Titus, Rome (82 CE)",
"img":"https://heurist.huma-num.fr/heurist/?db=judaism_and_rome&file=1c29ae0f2b3d245fb5d4ec47b9e286f9369ba03c"},
{"title":"Masada, King Herod's fortress and palace in the Judean desert (1st century BCE)",
"img":"https://heurist.huma-num.fr/heurist/?db=judaism_and_rome&file=646583fae1f0cbafe699b78a5c62b28d4136329f"},
{"title":"Temple of Gaius Caesar and Lucius Caesar (Maison Carree), Nimes (16 BCE)",
"img":"https://heurist.huma-num.fr/heurist/?db=judaism_and_rome&file=0bff598aa8716da5cada589c2dfcbf5372f9b239"},
{"title":"The Portonaccio Sarcophagus (190-195 CE)",
"img":"https://heurist.huma-num.fr/heurist/?db=judaism_and_rome&file=30978cab2499206d66c132659e4c7a986ccd1eb5"}
];
window.hWin.HEURIST4.ui.initGalleryContainer(gallery, {content:images, maxWidth:1220, maxHeight:250, showTitle:true});
}
Exporting geo.X and geo.Y
How do I export geo.x and geo.y rather than a WKT for the locations
X, Y {$r.f134.f28_geojson['coordinates'][0]}, {$r.f134.f28_geojson['coordinates'][1]}
Video
Video can be embedded by specifying the URL as a remote file in a File field
webpage: 3D objects id 782
3D objects
Heurist now provides support for 3D objects (2 Dec 2022) using 3DHOP and ???
![][image13]
Preliminary documentation
Obj file should be converted to nxs and compressed to nxz with Nexus utilities. Then nxz can be uploaded and registered.
Note: need to add nxz extension to the database usinf Admin > Manage Files and link at top right.
This is not yet added to all databases.
3dhop viewer requires direct access to the 3d object file. Add the following .htaccess to the upload directory containing the file (normally file_upload).
order allow,deny
<Files ~ "\.(nxz|nxs|ply)$">
allow from all
</Files>
Further documentation to be provided soon - please bug us if not updated within a month (2 Dec 2022)
3D Viewer embedding
1) To redirect to 3d viewer need to specify parameter mode=page
2) In Smarty the standard wrap function {wrap var=$r.f38_originalvalue dt="file" height="640" width="800"}
should generate
<a href=" ./?db=MBH_Manuscripta_Bibliae_Hebraicae&file=6435acd4e132673956e0962ab2dcafe0ed0ef429&mode=page " target="_blank" rel="noreferrer noopener"><img src="/?db=MBH_Manuscripta_Bibliae_Hebraicae&thumb=6435acd4e132673956e0962ab2dcafe0ed0ef429"></a>
I've modified Template 3d-models-page.tpl for FBX:
version 1 :{wrap var=$r.f1128\_originalvalue dt="file"}\<br\>
            version 2:
          \<a
            href="{HEURIST\_BASE\_URL}?db={HEURIST\_DBNAME}\&mode=page\&file={$3dObject.f1128\_originalvalue\[0\].ulf\_ObfuscatedFileID}"
                target="\_blank"\>3d viewer\</a\>\<br\>

            version 3:
          \<a
            href="{$3dViewer}{$3dObject.f1128\_originalvalue\[0\].ulf\_ObfuscatedFileID}"
                target="\_blank"\>
Handling 3D objects.
Heurist now provides the O3DV and 3DHOP viewers. 3DHOP is useful for nxz - since this format can be produced from obj and is ten times smaller - and will be shown for this format. For oteh formats o#DV will be used. O3DV supports nearly all known formats: 'obj', '3ds', 'stl', 'ply', 'gltf', 'glb', 'off', '3dm', 'fbx', 'dae', 'wrl', '3mf', 'ifc', 'brep', 'step', 'iges', 'fcstd', 'bim'
Preliminary documentation
Obj file should be converted to nxs and compressed to nxz with Nexus utilities. Then nxz can be uploaded and registered. nxs files can be up to 10 times smaller than obj files.
Nexus can be downloaded from
https://www.3dhop.net/download.php or from github
http://vcg.isti.cnr.it/nexus/
nxsbuild 40microns.obj -o 40microns.nxs
nxsedit 40microns.nxs -z --compress
Note: need to add nxz extension to the database using Admin > Manage Files and link at top right. This is not yet added to all databases bugt should be in all new databases in 2023.
3dhop viewer requires direct access to the 3d object file. Add the following .htaccess to the upload directory containing the file (normally file_upload).
order allow,deny
<Files ~ "\.(nxz|nxs|ply)$">
allow from all
</Files>
PDFs
To open PDFs inline in a custom report :
- Database must be in js_in_database_authorised.txt
- Need to use wrap function {wrap var=$r.f38_originalvalue dt="file" width="300" height="auto" mode="link" fancybox="1"} Mode can be “link” or “thumbnail”
- It adds all required scripts and style into <head> automatically
Date rendering
est-il possible de les afficher autrement que sous la forme "11 Apr 1916" ?
- En Record View et par defaut en Custom reports nous avons choisi ce rendement pour faire plus lisible.
- En Data entry nous préférons ISO date.
- En Custom Reports (qui utilise Smarty) on peut avoir ce qu'on veut,
pe. {$r.f10|date_format:"%D"} --> 04/12/55
voir: https://www.smarty.net/docs/en/language.modifier.date.format.tpl
Changing date language (discussion)
Le 21/09/2022 à 10:53, Régis Witz a écrit :
Rebonjour,
Effectivement, d'après ce que je vois des résultats de votre facet "Doctorants", vous utilisez bien un format du type "JJ MMM AAAA" français ; cependant, le nom des mois est anglais (par exemple "Feb" au lieu de "Fév").
De ce que j'en sais, Smarty (le langage dédié servant en grande partie au formattage des custom reports) ne permet pas ce genre de configuration, ce qui semble normal : en général, les noms de mois sont déterminés en fonction de la locale (~le langage) du système, qui est actuellement en anglais.
Hors Heurist, je vous dirais "utilisez une directive PHP" (voir cette discussion ; en résumé rajouter quelque chose du genre setlocale(LC_TIME, fr_FR.utf8); ), mais je ne suis pas sûr si Heurist vous laisse la main là-dessus. À tester ou attendre une réponse de quelqu'un de plus éclairé que moi ... :/ ;)
Une alternative à votre disposition (pour "cacher la poussière sous le tapis") peut être d'utiliser un pur format numérique, genre JJ/MM/AAAA, comme ça votre "18 Feb 1780" deviendrait "18/02/1780" et hop, ni vu ni connu 🤫 ...
Cordialement, Régis
Le 9/21/22 à 10:13, Sébastien Clément a écrit :
Bonjour Régis,
Merci pour cette réponse rapide !
On utilise déjà les reports : https://eslettres.bis-sorbonne.fr/?db=eslettres&website&id=18050&pageid=36122 mais ça ne fonctionne pas...
J'ai raté une étape ou c'est plus compliqué qu'il n'y parait ?
Bien cordialement,
Sébastien
Le 21/09/2022 à 10:08, Régis Witz a écrit :
Bonjour Sébastien,
Une possibilité est d'utiliser un custom report, que vous pouvez configurer dans l'onglet report de la vue détaillée correspondant à votre recherche (zone toute à droite).
Ça vous permettra ainsi de configurer non seulement la manière dont vous affichez vos dates, mais aussi la manière dont vous affichez ... ben, tout ce qui concerne un type de donnée particulier.
Cordialement,
Régis
Le 9/21/22 à 07:19, Sébastien Clément a écrit :
Bonjour,
Je n'ai pas trouvé à quel endroit paramétrer l'affichage des dates ?
Elles s'affichent sous la forme 1 May 1900, nous aimerions les afficher en français...
Merci et bonne journée à tous,
Sébastien
Publishing: report (re)generation
The Smarty report formatter can be quite slow for large and complex reports. However, where these reports are generated repeatedly one has the option to generate the result and save it so that it can simply be loaded from html.
First set up the report you want, the click on the globe icon above the report:

Then click on Set up publishing schedule:

Finally, add a new report schedule:

and set the values (file name is provided automatically)
1440 minutes corresponds to a daily update

Note: as of 19/5/2022 this function, developed many years ago and relatively little used, works well but the automatic triggering of the file refresh is not operational. If you require this, please send us an email (support at heuristnetwork dot org).
What is the methodology on creating saved custom report output?
Michael thinks the custom report output is cached, so it can take 2 or 3 minutes to generate (for some reports on Libraries database on Huma-Num) the first time it is called but then will load from the saved version.But my memory is you have to manually generate a saved version and then reference that version, and it is only updated on a manual request like the one below.I am assuming you cannot run the update of a saved report from the command line, so it cannot be called from a cron job. Am I correct? For example this will update one of the reports for the Libraries database, but if I understand rightly must be run by a logged in user on the Libraries database:https://heurist.huma-num.fr/h6-alpha/viewers/smarty/updateReportOutput.php?db=Libraries_Readers_Culture_18C_Atlantic&publish=1&id=1
/viewers/smarty/updateReportOutput.php has the following parameters
ID - rps_ID from usrReportSchedule (i.e. explore tab -> report tab -> globe icon -> schedule publishing reports), if “id” is 0 it triggers sequential refreshing of all the reports
/viewers/smarty/updateReportOutput.php has the following parameters
ID - rps_ID from usrReportSchedule, if “id” is 0 it triggers sequential refreshing of all the reports
PUBLISH accepts the following values
3 - it takes the existing report from generated-reports/ folder. There is rps_FilePath, although it is not defined via UI. If report does not exist it regenerates report with value “1”
2 - regenerates report without output
1 - generates report and outputs it (DEFAULT)
0 - generates report and outputs message with links
MODE
Html - default
Js - html is wrapped into js document.write
I just read Artem’s summary – there is actually a detail that I think he may have overlooked. If you call the updateReportOutput script with publish=3, there is a little section that appears to regenerate the report in the background if the interval has elapsed:
if($row['rps_IntervalMinutes']>0){
$dt1 = new DateTime("now");
$dt2 = new DateTime();
$dt2->setTimestamp(filemtime($outputfile));
$interval = $dt1->diff( $dt2 );
if($interval->i > $row['rps_IntervalMinutes']){
$publish = 2;
}
You see it changes the $publish parameter to 2, which should in principle cause it to regenerate the report – though I think it may serve the user the old version and simply save the regenerated version for the next visitor. That’s actually not a bad approach as it maintains the download speed.
Functions available from $heurist
- baseURL: Get the URL base for the current server
- getRecords: Perform a standard record search
- Parameters:
- Query => Heurist query [Required]
- Current Records => Record id or Recordset [Optional]
- Returns:
- Array of record IDs from query results
- NULL on error
- getRecord: Retrieve record metadata and field values
- Parameter:
- Record ID [Required]
- Returns:
- Array of record details
- An empty array
- NULL on error
- getLinkedRecords: Retrieve records linked to the provided record, whether by record pointer or relationship marker field(s)
- Parameter:
- Record ID [Required]
- Record Type ID: to filter by a specific entity/record type [Optional]
- Direction: retrieve only those linked from or to the provided record {‘linkedfrom’, ‘linkedto’, null} [Optional]
- Returns:
- 2D array of linked records array(‘linkedfrom’ => array(), ‘linkedto’ => array()), these returned records will only contain metadata values; e.g. ID, type ID, last modified, etc…
- getRelatedRecords: Retrieve record relationship details for the provided record (specifically the Record relationship #2-1 records)
- Parameter:
- Record ID [Required]
- Returns:
- Array of relationship details including; relation type, notes, start and end dates
- An empty array
- getRecordsAggr: performs an aggregation of record values
- Parameters:
- Functions: 2D array of field IDs and function labels, e.g. array(array(10, ‘sum’), array(21, ‘count’), …); available functions are avg, sum, and count [Required]
- Query or Record ID: Either a Heurist query or an array of record IDs [Required]
- Current Records => Record id or Recordset [Optional]
- Returns:
- Array of aggregated values
- NULL on no aggregation
- getTranslation: Get translated text values for terms, record types, and base fields
- Parameters:
- Entity: Which entity to retrieve a translation for {trm, rty, dty} [Required]
- Entity ID: Array of record type, base field, or term IDs [Required]
- Field: Which translated value would you like, e.g. for terms would you like the translated label (label or trm_Label) or description (desc or trm_Description) [Required]
- Language Code: The 3 letter ISO code identifying the desired language [Required]
- Returns:
- The translated text, or an array of translated text
- getFileField: For files, get a specific field value
- Parameters:
- File details: Array of Obfuscated File IDs (the value typically returned for File fields) [Required]
- Field: Which field to return, defaults to name {name, description, caption, copyright, owner, type} [Optional]
- Returns:
- The requested field’s value, or an array of field values
On providing a field not handled, the original provided details will be returned
Loading searches in a new web page
Heurist includes the query as a parameter at the end of the URL to allow bookmarking a page + the query carried out on that page.
If an interger number is specified as the URL, Heurist will navigate to the page identified
<a=”q=f:1085:{$keyword.internalid}”>It executes the specified query</a>
To execute this query on a different page you need to specify “Info directs to page” in the widget property
from public-record.tpl in https://heurist.huma-num.fr/h6-alpha/?db=judaism_and_rome
{$all_records_page = "{HEURIST_BASE_URL}?db={HEURIST_DBNAME}&website&id=7&pageid=5943"}
<p><strong>Keywords in the Original Language:</strong></p>
{foreach $r.f1118s as $keyword name=kwLoop}
<button>
<a href="{$all_records_page}&q=f:1118:{$keyword.internalid}"
data-query="f:1118:{$keyword.internalid}" data-search-page="5943"
data-search-realm="search_group_1">
{$keyword.label}</a>
</button>
{/foreach}
<p><strong>Thematic Keywords:</strong></p>
{foreach $r.f1085s as $keyword name=kwLoop}
<button>
<a href="{$all_records_page}&q=f:1085:{$keyword.internalid}"
data-query="f:1085:{$keyword.internalid}" data-search-page="5943"
data-search-realm="search_group_1">
{$keyword.label}</a>
</button>
{/foreach}
List of allowed php functions for Smarty (Custom reports)
is in viewers/smarty.smartyInit.php
// disable PHP functions except listed, set to null to disable ALL
public $php_functions = array('isset', 'empty', 'constant', 'count', 'escape',
'sizeof', 'in_array', 'is_array', 'intval', 'implode', 'explode', ......
Custom report display size
- JS for avoiding multiple scroll bars (resizing of the iframe for reports) -
<11/5/23: Maël to supply, or Michael's version, but Maël specifying the issue for Artem to look at, so may have been centrally fixed>
To automatically resize iframes (especially custom reports, which are rendered in an iframe) rather that having a fixed height, here are two options :
1) The one developed by Michael
Add the following script to “customization javascript” of the CMS_Home record AND add the css class “auto-resize-custom-report” in the site editor to each of the custom report widgets you want ot resize
// RESIZE EMBEDDED CUSTOM REPORTS BASED ON CONTENT
const mainContentNode = document.querySelector("#main-content");
const observerOptions = {
childList: true
};
function resizeIframe(elem) {
$(elem).css("height", elem.contentWindow.document.body.scrollHeight+100);
}
function attachCustomReportListeners() {
// Find embedded custom reports in new page
let customReportContainers = $(".auto-resize-custom-report");
// Attach onload and resize listeners to each one to resize
if (customReportContainers.length > 0) {
customReportContainers.children("iframe").each((idx, elem) => {
$(elem).on("load", () => {
resizeIframe(elem);
});
$(elem).on("resize", () => {
resizeIframe(elem);
})
});
}
}
function refreshIframeResize(mutationList, observer) {
mutationList.forEach((mutation) => {
switch (mutation.type) {
case 'childList':
attachCustomReportListeners();
}
});
}
// reapply custom report resizer each time new page is loaded
const customReportObserver = new MutationObserver(refreshIframeResize);
customReportObserver.observe(mainContentNode, observerOptions);
attachCustomReportListeners();
2) the one I’ve used
Add the following script to “customization javascript” of the CMS_Home record
function ajdustIframeH() {
setTimeout(() => {
$('.autoiframe iframe').height( $('.autoiframe iframe').contents().find("body div").height()+50);
$('.autoiframe iframe').attr("scrolling", "no");
$(window).scrollTop(0);
}, 50);
};
$(document).on('iframeready', ajdustIframeH);
And add the following script in each of the custom report template you want to resize
<script>
window.onload = function() {
var w = window;
if (w.frameElement != null
&& w.frameElement.nodeName === "IFRAME"
&& w.parent.jQuery) {
w.parent.jQuery(w.parent.document).trigger('iframeready');
window.parent.scrollTo(0,0);
}
};
</script>
The report formatter in use = Examples
@todo: find some good examples
Developing a WYSIWYG version
We hope to introduce a (semi-) WYSIWYG report formatter in 2026. It will most likely be based on the current TPL report format to avoid migration difficulties, but will replace many of the obscure code snippets with a clickable widget marker which will pop up a form with all the settings currently embodied in a section of code.
This will not be entirely WYSIWYG due to the difficulty of rendering loops, conditionals, lists and so forth, but will make the editing much easier and more or less foolproof.
Watch this space (or at least, the interface!).
Media rendering
webpage: Adding Javascript id 664
When building these we will be able to select the fields in connected entities from a tree view, for example when building a filter for Persons one can make selections of fields in their Life Events, including fields of the Places linked to their Life Events (left).


Note: the simple filter builder (left), facets builder (right), calculated field and custom reports editor each use a slightly different form of tree, due to slight differences in requirements (eg. multiple selection in the facets builder), but the principle is the same.
Custom Reports Cookbook
On this page, we introduce a number of 'recipes' for commonly-requested features in Custom Reports, and also provide some 'recipes' for writing clearer, cleaner, easier-to-maintain reports.
- Create a 'detail' or 'single record' view
- Create a custom 'display' function
- Limit the number of reports
- Eliminate annoying whitespace
- Create an interactive table view
- Link multiple reports together
- Reuse code in a systematic way
Create a 'detail' or 'single record' view
There are two main ways you can display records: you can display many at once, or you can display one at a time. A Custom Report can be used for either purpose. In the website editor, you can control whether a custom report will display one or many records by setting the 'display selected record only' option in the custom report widget.
If you are designing a custom report to display a single record only, you can remove the {foreach} loop that is included by default in the custom report widget. This can make your code easier to understand, and can also ensure that the report doesn't accidentally show many records when it is only designed to show one at a time.
If you wish to do this, you can delete the {foreach} loop and repalce it with the following code:
{$r = $heurist->getRecord($results[0])}
Now the $r variable just contains the information about the first record in $results, and there is no need for the {foreach} loop.
Create a custom 'display' function
You may find as you build a report that you wish many fields to be displayed in the same way. Perhaps you would like each field to have a heading in bold. Perhaps when you display a dropdown field, you want to use the whole 'term' (e.g. 'Fiction.Detective Novel' or 'Poetry.Epic'), or you wish simply to use the 'label' ('Detective Novel', 'Epic') every time. Perhaps you want each field to be in its own paragraph (<p>), so that it appears on its own line, or by contrast you would like all the fields to appear stacked next to each other.
In such cases, it can be useful to define your own {display} function which you use to display fields each time. Below is an example you can work from:
{function display sep="," suffix="" lineBreak=False}
{if ($r.$field)}
<p><strong>{$label}:{if ($lineBreak)}<br>{/if}</strong>
{if ($r.$field|is_array)}
{if (array_key_exists("label", $r.$field))}
{$r.$field.label} {$suffix}
{else}
{foreach $r.$field as $item name="fieldLoop"}
{if (array_key_exists("label", $item))}
{$item.label}{else}{$item}{/if}{$suffix}{if (!$smarty.foreach.fieldLoop.last)}{$sep}
{/if}
{/foreach}
{/if}
{elseif ($r.$field)}
{$r.$field} {$suffix}
{/if}
{/if}
{/function}
Once you have defined a function like this, you can use it throughout your report like so:
{display field="f1" label="Name"}
Name: John
{display field="f4" label="Description" lineBreak=True}
Description:
A description of John contained in the field #4.
There are multiple ways of finding out the number of each field you wish to insert:
- you can insert the field into the report using the 'insert field' tool in the Custom Report builder, or
- in a seperate tab, open a record of the relevant type and enter 'Modify Structure' mode. When you hover over a field in the treeview to the left, the field's number will appear in a tooltip.
Limit the number of reports
Even if you follow best practices, custom reports can be difficult to read and maintain. It is often a good idea to limit the number of reports that you write for a particular database. In the most common case, you will be using a custom report with the 'custom report' widget to display a single record at a time. In this case, it is a good idea to write a single custom report, perhaps called 'public-view', which will be used to display all records in the database when you want to view them one-at-a-time. You may also have a report at displays multiple records at once. You might like to call this one 'public-list'.
When creating a new custom report, consider carefully whether it would be easier simply to extend an existing report. Of course, this relies on the idea that you have made your reports extensible. If reports are difficult to extend, then it will be difficult to limit the number of reports you need to maintain.
One advantage of the {display} function shown above is that it displays *nothing *if the relevant field does not apply to to the record. That is the purpose of the {if ($r.$field)} ... {/if} tags. This means that you can safely use {display} to try and display fields from many different record types, even if the record types have different fields. For example, imagine you had the following code in your Smarty report:
<p><strong>Name:</strong> {$r.f1}</p>
<p><strong>Age:</strong> {$r.f1000}</p>
If this code were used to display information about a Person, it might create generate the following html code:
<p><strong>Name:</strong> John</p>
<p><strong>Age:</strong> 22</p>
This html would look like this on the web:
Name: John
Age: 22
Now imagine the same code were used to display fields from a Film record. Films do not have any 'age' data in your database, so the report would output the following:
<p><strong>Name:</strong> Agnatuk</p>
<p><strong>Age:</strong> </p>
This html would look like this:
**Name: **Agnatuk
**Age: **
If you had instead used the above {display} function, it would look like this:
**Name: **Agnatuk
Using the {display} function means that you can mix and match fields from many different record types in a single report. Making the report work for a new record type can be as simple as adding a few more fields to display. If you would like the label to change based on the record type, then you can add some {if} tags as required using the handy 'if' feature in the 'insert field' menu to the left of screen. So, for example, let's say that for all your
***Date rendering ***
Date values are already in human readable format. To render BCXE and CE use the following example:
{$r.f10} {((strpos($r.f10,'BCE')>0)?'':'CE')}
Smarty: testing values
Term fields have five components which can be referenced - the ID (.id), the term label (.term), the standard code (.code), the description (? .description, but might be .info or .label TBV) and the semantic URI (? .URI or ? .semanticURI tbc) ). The last three are optional and most often blank. For example:
{if ($ref.f1002.id) == 9412} {* Type of publication.id *}
{if ($ref.f1002.id) != 9412} {* Type of publication.id *}
Detecting visibility of records
{if ($source.recIsVisible!==false)} …. {* record is visible to public *}
Getting records which link to current (linkedfrom)
This will get type 64 records which link to the current record:
{$linked\_ed\_events \= $heurist-\>getLinkedRecords($e\_id, 64, 'linkedfrom')}This will get and display titles of all records which point to current item (see also linkedto):
<b>Linked from:</b>
<br>
{$linked_items = $heurist->getLinkedRecords($rec_id, null, 'linkedfrom')}
{$linked_items = $linked_items['linkedfrom']}
{foreach $linked_items as $rec_id2}
{$r2 = $heurist->getRecord($rec_id2)}
<a href="{$r2.recID}" target=_blank>{$r2.recTitle}</a> <br>
{/foreach}
A more compact version
{* This is an example of getting records which point to the current record *}
{* Change to an approriate type. You can also use 'linkedto' *}
{* You can also use the record type ID, in this case 102, in place of Notices *}
{$recs = $heurist->getLinkedRecords({$r.recID}, 'Notices', 'linkedfrom')}
{$recs = $recs.linkedfrom}
{foreach $recs as $id}
{$rec = $heurist->getRecord($id)}
<a href="https://wherever you want this to go">{$rec.recTitle}</a><br>
{/foreach}
Getting linked records (linkedto)
Simply replace the linkedfrom keyword with linkedto
Displaying image credits
{$r.f38_originalvalue[0]['ulf_Description']}
See https://HeuristRef.net/ Heurist_Help_System/web/39/737
Eliminate annoying whitespace
If you find that whitespace is being created in your report, you can wrap the entire report in {strip} tags. The {strip} tag tells Heurist to delete whitespace from the code of the report when the report is 'compiled' (i.e. translated into a more basic computer language that Heurist can understand). Simply add {strip} to the very start of your report, above every other line of code, and then place the closing tag {/strip} at the very end:
{strip}
{* Entire report here *}
{/strip}
**NB: **If you do this, it will change the look of error messages when you save/compile the report. Since the entire report takes place inside a {strip} block, all error messages will say that the error took place within a 'strip'. This is not a problem, but may be confusing the first time you see it.
Create an interactive table view
You can create a basic tabular view of records in your database using the List View pane. The List View is quite powerful, and allows you to visualise records in a table, including data from linked records. For example, you can display a table of 'books', but include the first name and last name of the linked 'person' records for the authors.
Some users, however, wish to display a table that can aggregate data (e.g. show the number of books per author), or want to control the layout and formatting of the table. This requires a custom report.
To create a table in a custom report, you need to understand html table syntax. In your custom report, delete the 'records loop' and insert the following snippet. You will see that the 'foreach' loop occurs inside the <tbody> element, which is the body of the table. Each record in the 'foreach' loop will create a new <tr> or 'table row' element. Each piece of data about the record should sit within a <td> or 'table data' element. Generally speaking, you need to make sure that the number of <td>'s for each record is equal to the number of <th>'s in the <thead> element—that is, you need to keep track of how many columns your table has, and structure it accordingly.
The 'class="display"' code is only necessary if you are using the datatables package to create an interactive table. If you do not plan to use datatables, then 'class="display"' can be omitted.
<table class="display">
<thead>
<tr>
<th>{* Heading for first column *}</th>
<th>{* Heading for second column *}</th>
<th>{* etc. *}</th>
</tr>
</thead>
<tbody>
{foreach $results as $r}
{$r = $heurist->getRecord($r)}
<tr>
<td>{* Data for first column, e.g. $r.f1 for name *}</td>
<td>{* Data for second column, e.g. $r.f9 for start date *}</td>
<td>{* etc. *}</td>
</tr>
{/foreach}
</tbody>
</table>
Making the table interactive
![][image20]
If you would like to make the table interactive (e.g. allow searching/filtering/sorting), then we recommend you use the datatables package, which Heurist uses to generate its List View. To include datatables your custom report, you need to perform two steps:
- Include JQuery in your custom report. Go to the CDN page of the JQuery site, and click on the 'minified' version of JQuuery 3.x at the top of the page. This will show you a <script> tag that you can copy-and-paste into the top of your custom report.
- Once you have included JQuery, you can include the datatables package. On the datatables download builder, select the options you would like to use in your table, then copy-and-paste the <script> and <link> tags at the bottom of the page into the top of your custom report.
You should do both these steps to ensure that you have the most up-to-date versions of JQuery and datatables in your report. You may wish to periodically update the software in your report by repeating steps 1 and 2.
When you are finished, the top of your custom report should look something like the snippet below, though it will look different due to your selected options and the day when you generated the code:
<script type="text/javascript" src="https://code.jquery.com/jquery-3.6.0.min.js"></script>
<link rel="stylesheet" type="text/css" href="https://cdn.datatables.net/v/dt/jszip-2.5.0/dt-1.12.1/b-2.2.3/b-html5-2.2.3/date-1.1.2/fh-3.2.4/r-2.3.0/datatables.min.css"/>
<script type="text/javascript" src="https://cdnjs.cloudflare.com/ajax/libs/pdfmake/0.1.36/pdfmake.min.js"></script>
<script type="text/javascript" src="https://cdnjs.cloudflare.com/ajax/libs/pdfmake/0.1.36/vfs_fonts.js"></script>
<script type="text/javascript" src="https://cdn.datatables.net/v/dt/jszip-2.5.0/dt-1.12.1/b-2.2.3/b-html5-2.2.3/date-1.1.2/fh-3.2.4/r-2.3.0/datatables.min.js"></script>
Finally, you need to tell the datatables software to activate the table you have created. This will make the table searchable/sortable, and apply the datatables formatting if you have included 'class="display"'. To activate the table, include code such as the following after the <table> element:
<script>
{literal}
$("table.display").DataTable({
// Include options here
});
{/literal}
</script>
You need to include <script> tags to indicate that the text is JavaScript code. You need to include the {literal} tags so that SMARTY is not confused by the JavaScript. If you have not used 'class="display"', then this code won't work, and you will need to change $("table.display") to more accurately tell datatables where the table is that it should activate.
Datatables has many options you can set. You will need to investigate the option on the datatables site, and then ensure you have included the necessary plugins when you build the datatables download.
Aggregating data
Many users like to use a datatable to aggregate data, e.g. to show the number of people born in each place, or to show the average duration of films in different genres. When you aggregate data, you count records rather than displaying them individually.
There are two ways to include aggregate data in a table:
- Use a calculated field to store the aggregation information in the database. Then you can simply create a basic table (or even use the List View), and use the calculated field in the display. For example, you might add a caculated field to each Place in your database which adds up the number of Films that use that place as a location. Then if you create a table of Places, it will be easy to include the number of films as a column.
- Use the custom report to perform the calculations. This will oftem make the report slow to run, so if you are likely to be adding up many records, then you will probably want to set up a publication schedule to update the report periodically in the background, rather than regenerating it each time a visitor views it (the default).
Link multiple reports together
Reuse code in a systematic way
You can reuse the code from other reports by including a report inside another one using {include}.
eg:
{include file="./CommonScriptaJs.tpl"}
{include file="./CommonScripta.tpl"}
Note that it does not work properly if your template name contains a space character.
Using seclected facet in a connected widget
- When I select a theme from the Interview extracts facet search on the left I want it to trigger a search for the same theme in the Theme descriptions table to display as a header for the selected interview extracts, as below (at the moment it is doing a search on all theme descriptions and just rendering the first one, Christmas).
The problem is that there is no connection between interview extracts and the theme descriptions other than that they both use the Themes field (id 1137). Interview extracts can have multiple themes, but we only want to select the one theme value that has been selected in the facet search. https://heuristref.net/h6-alpha/parramatta_region_food_cultures/web/68/178
Do you have any (simple, reproducible) ideas how to do this? Javascript? If there isn't a reasonably simple way of doing it we will do without the heading and simply put links to the themes for each extract and have them pop up the appropriate theme description.
I believe we can run a query through the smarty template, which returns an array of record ids. Then we can get the record details for the first result.
{* This report ONLY renders the theme description record, type 109, which is to appear at the top of the page when a theme is selected. f1137 is the field for Theme in the Interview Extact *}
{* Construct the query for a theme description record (type 109) containing the same theme field value *)
{* PROBLEM: this will get the first theme from the first record in the resultset, which may not be the one you actually selected *}
{$term_id = (isset($selected_term)) ? $selected_term : $r.f1137.id}
{$query = array("t" => "109", "f:1137" => $term_id)}
{* Get an array of Theme description records with the indicated them value - should only return one record *}
{$rec_id = $heurist->getRecords(json_encode($query))}
{* Get the record to be output *}
{$record = $heurist->getRecord($rec_id[0])}
<b>{$record.f1}</b> {*Title*}
<p>
{$record.f4} {*Introduction/description of theme*}
{break}
$term_id just needs to be the term id or label. The header report should be getting the resulting interview extract record, and thus the necessary term id
Counting records of different types:
- From Vincent Paillusson:

Ce code est complet et fonctionne avec n’importe quelle base ou set de résultats (que ce soit sur l’ensemble des record type ou seulement un seul)
Et voici ce qu’on obtient lorsqu’on ouvre le custom report dans un navigateur (Attention le nombre de résultats étant limité dans les tests et dans la visualisation des custom report via le mode Explore il ne sera pas possible d’afficher la totalité des ressources autrement qu’en ouvrant le custom report dans un navigateur):
- Adding counts for entity types to a custom report
Ce code rendra le décompte (partie significative en gras).
<b>Total records:</b> {$heurist->getSysInfo('db_total_records')}
<br><br>
{$rty_Counts = $heurist->getSysInfo('db_rty_counts')}
<table>\<tr\> \<td\>\<b\>Entity type\</b\>\</td\> \<td\>\ \ \</td\> \<td\>\<b\>Count\</b\>\</td\> \</tr\> **{foreach $rty\_Counts as $rty\_ID=\>$rty\_Count}**
<tr>\<td\>**{$heurist-\>rty\_Name($rty\_ID)}** \</td\> \<td\>\</td\> \<td\>**{$rty\_Count}**\</td\> \</tr\> **{/foreach}**
</table>
Finer points of report formats for websites
Getting a data table loaded with JS to limit width of unimportant columns which may have a few really long meandering values …
I’ve added the following mods to this report
.dt-wrap {
white-space: normal !important;
word-break: break-word;
max-width: 300px;
}
And columnDefs for dataTable options:
$table.DataTable({
data: resultsData,
fixedHeader: true,
order: [[0, 'asc']],
dom: '<Q><"flex-spread"lrB>tip',
responsive: true,
deferRender: true,
columnDefs: [
{
targets: 2, // Attested Occupation
width: "200px",
className: "dt-wrap"
}
]
});
Explanation from Artem:
It is 2d for zero index based array of columns.
{$member_rows[] = [
"<a href=\"{$member_url}\" target=\"_blank\">{$member_name}</a>",
$member_data.f20.label,
$attested_occ,
$standard_occ,.....
and in table
<th data-priority="1">Borrower</th>
<th data-priority="1">Gender</th>
<th data-priority="3">Attested Occupation</th>
<th data-priority="2">Standard Occupation</th>
8c : Mapping & Visualisation
Documentation written on 13/11/2025 by Sylvain Besson (MSH Lyon Saint-Étienne / CNRS) Updated 12/05/2026 by Maxine Schoehuys--Kreiss
1. Spatio-temporal view
🚀 How to start
Explore → Search → Map
- To begin, click on [Explore] ①
- Perform a search or use a [Saved Filter] that returns the records you want to include in your map ②
- Click on [Map] ③

The Map view is divided into two parts: a map and a timeline. Both parts are interactive and interact with each other.
The map shows the current record set, if you want to display only some of your records, use a filter or make a specific search. The map will then show the results of your query. However, to be displayed on the map and the timeline the records should have at least one of:
- a field with geospatial data (to display on the map)
- a field with temporal data (to display on the timeline)
To get more information on field types, check Chap 4. Data entries @TODO.
1.1. The map
The records are clustered depending on their spatial closeness. It changes as the view is zoomed in or out. Clustering can be set in the layer description record.

The map will display pointers taken from the geodata in you records. There are two possible sources of geodata that can be drawn: current result sets (search results) and map layers. The displayed field from the result set is normally Location (a geospatial field).
A map document contains map layers, which define the appearance of the data in each layer.
Some tools are available in the header:
- [Legend] ① :
- [Result sets]: choose which set of records you want to display or hide
- [Map Documents]: choose or import a background map (borders, geo features, tiled image background)
- [Base map]: choose which base map you want to use (e.g. OpenStreetMap)
- [Zoom in] and [Zoom out]
 ②
② - [Zoom to full extent]③
- [Help]
 ④
④

On the map, several features are available:
- [Bookmarks] ① : add a landmark directly inside the map to retrieve later
- [Search] ② : explore the map using place names (ex: "New York"). The results are those indexed by OpenStreetMap.
- [Print] ③ : print a selected view of the map
- [Map publication] ④ : generate an iframe to display the map on another web page and choose which map features to implement. It is also possible to export the map in KML format to use on Google Earth.

1.1.1 Focus on map publication
① You can display the map on another web page. You can configure the features you want on the web page :
- [Include]: choose what queery can be seen on the published map
- current query
- opened map documents
- [Controls]: choose which controls can be used on the published map
- legend (shown on the right of the published map)
- bookmark
- geocoder / search feature
- selector
- [Visible in legends]: choose what can be seen in the legend
- basemap
- result set
- map documents
- [Other settings]: control general aspects of the presentation
- use current basemap
- allow modify symbology
- show map
- show timeline
- markerclusters
- [Popup template]: choose another popup template than the basic one
② Copy the HTML iframe code directly in your web page. If you use a CMS like Wordpress, you must enclose within <code></code>. You can choose between embed or web safe code, the later only modifies the special characters.
③ You can export a map in KML format for Google Earth.

1.1.2. Focus on the Heurist map document
You can change the background of your map using the map document feature. To create a new map document, select the [Add +] button in the legend of the map view. A map document contains one or more map layers, and can be accompanied by a date, a creator, a creative commons licence, copyright information and a description. A map layer needs a file or service which delivers the map data - Shapefile, KML, GeoTIF, Tiled image, MrSID service etc.
The Date field in the metadata of both map document and map layer will show on the timeline. You can choose to hide all dates from the timeline by unchecking the box, however this will also hide the results from your current query that also use a Date field.
First, create a map document, these are the mandatory fields:
- name of map document
- bounding box : using the tool on the left select a rectangle, that expresses the maximum extents of the two-dimensional object you want to map
- map layers (see below)
- map-zoom bookmarks: pre-defined zoom areas. The first bookmark will determine the initial map zoom. Specify as Name,Min Longitude,Max Longitude, Min Latitude, Max Latitude, Start date/time and End date/time (both optional).
- zoom on point selection (km): the area to which to zoom when you select a point object (by default: 5km)
Then, import one or more map layers by clicking [Map layers], these are the mandatory fields:
- layer name
- map layer data source: can be a KLM file or snipet, a map image file (non-tiled or tiled), a mappable query, a shapefile. Each of those will need another bounding box and a title.
- type of data source: Google maps, Heurist query, raster or vector
🛟 Tip: Use the symbology field and the style editor feature to create the presentation you like on each layer of your map. You can choose to show or hide each map document and each layer in the legend of the map.
1.2. The timeline
The records are distributed on the timeline under the map. ①
Any time field will be projected on the timeline. If several time fields are used on a record, they will all automatically show on the timeline. To hide a specific time field, uncheck the corresponding box on the left on the timeline under [Current query].
🛟 Tip: Invalid dates will not be displayed on the timeline. Dates should be written according to ISO norm: yyyy, yyyy-mm, yyyy-mm-dd. Use minus (-) for BCE dates (eg. -375 for 375 BCE).
The timeline has various navigation features:
- [Zoom in] and [Zoom out] ②
- [Zoom to all] ③
- [Zoom to selection] ④
- [Move to start] and [Move to end] of the records ⑤
- [Timeline options] ⑥ :
- choose the length of the labels: full length labels, truncate label to bar, fixed label width, or hide labels
- choose the label's position: within the bar, or above the bar
- choose the bar's position: stacked on the above the other, or wrapped to minimise height of timeline
- filter map with current timeline range

2. Network view
🚀 How to start: Explore → Search → Network :::
- To begin, click on [Explore] ①
- Perform a search or use a [Saved Filter] that returns the records you want to include in your network ②
- Click on [Network] ③

The Network view displays a records' network diagram. It provides an interactive visualisation of the current results set. Records are shown as nodes, and the connections (pointer fields and relationships) as the lines between nodes (edges).
🛟 Tip: To get it working, two conditions must be met:
- records or records types should be linked
- the current results set should gather all the records you want in your diagram
DON'T PANIC if the diagram is not understandable immediately !
@todo: The diagram below has been replaced with a new and much more capable 'ego-network' diagram (from March 2026) which allows you to start with one or a small number of records, see all the connections from those records, and then expand the diagram outwards either by double-clicking records marked as having connections or from all the displayed records. This diagram will be further expanded with the ability to colour code or symbolise different characteristics of the nodes.
Here's an example of a network diagram:

Each node displayed is a lab or a project. It shows how labs are interconnected through shared projects. Here you can see a record directly in the network viewer on the left.
Some features are available on the header to make your diagram more accessible:
- [Node Control]:
- Select mode ① : select and drag simple node or select and drag multiple node by a selecting box (click-right and drag)
- Gravity ② : determine to what degree entities are repositioned around the selected entity based on their relative weightings. Turn it on to choose the best presentation, and turn it off to lock down its position.

- [Link Control]:
- Links ① : show or hide empty links and expand links
- Node Size Formula ② : choose between linear or logarithmic formula
- Fixed ③ : fix the size of the links

- [Graph Control]:
- Refresh Data ① : go back to the original presentation of the nodes
- Open or close Fullscreen ②
- View Mode ③ : choose to show only the name of the record (big or small) or its name and its first field
- Set Zoom ④ : zoom in or out of the diagram and set the view back to show the complete diagram
- Export ⑤ : export the network data to a Gephi GEFX file

3. Crosstabs
🚀 How to start: Explore → Search → Crosstabs
- To begin, click on [Explore] ①.
- Perform a search or use a [Saved Filter] that returns the records you want to include in your network. ②
- Click on [Crosstabs] ③

The Crosstabs view provides a quantitative analysis of your data by calculating counts of aggregations sorted by category. A cross-tabulation is a way of calculating counts of aggregations sorted by category.
Imagine value (set to Var 1) is the value of a colour system that has the entire spectrum of colours encoded as numbers. Numbers that are close to each other represent colours that are close to each other. Imagine that the type field (set to Var 2) indicates what material the potsherd is made out of. We can use a cross-tabulation to generate instant categories by splitting up the entire range of entered values into 10 buckets, or deciles.
To run a simple cross-tabulation, search for the records you wish to analysis and select [Crosstabs]. The [Crosstabs] dialog displays. In the show fields for dropdown ①, select the record type you wish to analysis. Complete the variables:
- ② Var 1 (rows) choose your first variable (this will simulate a tabulation by that variable).
- ③ Var 2 (cols) choose the second variable (this splits the range of values into 10 'buckets' and counting how many values appear in each 'bucket' by type.
- ④ Var 3 is an optional variable that breaks the analysis further, into 'pages'.
Additionally, you can assign intervals by clicking on the pen ⑤.

3.1. Focus on intervals
It is possible to reassign intervals by merging, adding or deleting them.
First, select the available values. By default, all values are selected.
Then, add or remove intervals ② :
- Click on [Add Interval] ④ to add an interval.
- Click on left arrow to remove an interval, .
- If you want remove all intervals, click on the blue arrow.
- If you want to reset intervals, click on [Reset] ③.

It is also possible to merge values:
- click on [Add Interval] ④
- select the values you wish to merge
- click on the right arrow
- rename the new interval

Some other functionalities are available:
- Click on [Save] to save the current settings ①
- Show the values count, the total of each row and or column, and their percentage ②
- Counts aggregates values ③
- Display or hide null values and blank rows and columns ④

3.2. Results
You can see the results in table form or in a pie chart.
🚨 Warning: you must select at least one variable to see some results.
The table's metadata is available ①. The table title can be customized ②. You can export the table in CSV or PDF format ③. You can search for a value in the table ④. The field or record type used as base for the crosstable is mentioned on its top ⑤.

You can also display your data as a pie chart.

8d: Summary : Mapping and visualisation
Summary automatically generated on 11/25/2025 using the gpt-oss:120b model from the servers of Onyxia (INSEE) based on the complete document of the chapter.
1️⃣ Spatio‑temporal Map tab
Action | |
|---|---|
1 | Click [Explore] . |
2 | Run a search or use a [Saved Filter] to retrieve the records you want to map. |
3 | Select a record (any record that contains the required fields). |
4 | Click [Map] |
Result: The interface splits into two synchronized panels – a map (top) and a timeline (bottom).
1.1 Prerequisites for a spatio‑temporal view
- At least one spatial field (coordinates, WKT, GeoJSON, etc.).
- At least one temporal field (date, date‑range, etc.).
If one of these is missing either the map or the timeline will not be populated.
1.2 Map panel
Tool | Description |
|---|---|
Legend | • Result sets – show/hide points belonging to the current result set. • Map Documents – (see Publish section). • Base map – choose background (e.g., OpenStreetMap). |
Zoom/Dezoom | Standard zoom controls (🔍). |
[full screen] | Expand the map to full‑screen mode. |
Help | Opens the contextual help window. |
[Bookmark] | Add a temporary point you can later retrieve. |
[Search] | Geocode a place name (searches OSM index). |
[Print] | Print the current map view. |
[Publish map] | Generates an iframe snippet to embed the map on another page, optionally with controls (legend, bookmark, geocoder, selector, print). • You can also export the map as KML for Google Earth. |
Clusterisation | Points are automatically clustered; clusters recompute on zoom/dezoom. |
1.3 Publishing a map (iframe)
Setting | What it does |
|---|---|
Include – current query | The iframe displays the map built from the query you just ran. |
Include – opened map documents | (still under documentation – shows any additional map layers you have opened). |
Controls | Choose which UI elements appear inside the iframe (legend, bookmark, geocoder, selector, print). |
Visible in legends | Choose which legend items are shown (basemap, result set, map documents). |
Other settings | Use current basemap, Allow modify symbology, Show map, Show timeline, Marker clusters . |
Popup template | You can pick a custom HTML template for the pop‑ups (create a new template in the Templates section of Heurist). |
Copy code | Two formats are offered: embed (standard (escaped for direct insertion in CMSs). |
Export to KML | Generates a KML file that can be opened in Google Earth. |
1.4 Timeline (chronological strip)
- Synchronized with the map: moving the timeline brush filters the points shown on the map.
- Tools (bottom bar)
- Zoom / De‑zoom – change the temporal resolution.
- Reset – return to the full time span.
- Downloading – export the timeline data (CSV) – see Export section for details.
- Left / Right navigation – step forward or backward in time.
- Timeline options – label display (full, truncated, fixed width, hidden), label placement (inside / above bar), bar stacking, bar wrapping, and a “Filter map with current timeline range” checkbox.
2️⃣ Network tab
Step | Action |
|---|---|
1 | Click [Explorer]. |
2 | Run a search or use a [Saved Filter] to collect the records you want in the network. |
3 | Select a record that will be the entry point of the network. |
4 | Click [Map] (the same button as for the spatio‑temporal view; the Network view appears). |
2.1 What you need
- Linked records (relationship fields) or record types that are already defined as linked.
- A query that returns all records you want to appear in the graph.
2.2 Main controls (header)
Control | Function |
|---|---|
Node Control | • Select mode – click‑drag a single node or draw a selection rectangle (right‑click + drag). • Gravity – toggle node‑to‑node attraction; turn on to let the layout settle, then off for a static view. |
Link Control | • Links – show/hide empty links and expanded links (links that open to show nested relationships). • Node Size Formula – choose linear or logarithmic scaling of node size. • Fixed – set a fixed link thickness. |
Graph Control | • Refresh Data – re‑load the graph if new records were added. • Open/Close Fullscreen – toggle full‑screen mode. • View Mode – Icon view, Basic info box, Full info box with link view. • Set Zoom – manual zoom slider. • Export – download the graph as GEXF (Gephi format). |
2.3 Tips for a readable network
- Turn Gravity on, let the layout settle, then turn it off.
- If the graph still looks tangled, click Refresh Data under Graph Control.
- Use the Select mode to isolate a subset of nodes and move them manually.
3️⃣ Cross‑tabular (Pivot) View
Step | Action |
|---|---|
1 | Click [Explorer]. |
2 | Run a search or use a [Saved Filter] . |
3 | Select a record (any type). |
4 | Click [Cross‑tabs] (also called Tableaux croisés). |
3.1 Building the table
- Choose the record type you want to analyse (right‑hand panel).
- Pick Variable 1 (dropdown Var 1) – the first field to cross.
- Pick Variable 2 (dropdown Var 2) – the second field (optional).
- Optionally add a Variable 3 (click the “+” icon).
- Click “Update results”.
If only one variable is chosen, you obtain a simple frequency table; with two variables you get a cross‑tabulation.
3.2 Assign / edit intervals (value grouping)
- Click the pencil icon (✏️) to open the Assign intervals dialog.
- Add Interval – press [Add Interval], select the values to merge, click the right‑arrow, then give the new interval a name.
- Remove Interval – select an interval and click the left‑arrow (or the blue “←” button).
- Reset – press [🔄Reset] to revert to the original value list.
All changes are reflected instantly in the table.
3.3 Table options
Option | What it does |
|---|---|
[save] | Store the current table configuration for later reuse. |
Show – Values | Show raw counts. |
Show – Totals | Show row/column totals. |
Show – Row % / Column % | Show percentages per row or column. |
Aggregates Counts | Switch between sum, average, etc. |
Hide / Show – null values, empty rows/columns | Clean up the display. |
3.4 Export & visualisation
- Export – click the Export button (top‑right) to download CSV or PDF.
- Chart (pie) – when only one variable is selected, a pie chart button becomes active; it displays the distribution of that variable.
At least one variable must be selected before any result (table or chart) appears.
📊 Quick‑reference of Heurist visualisation tabs
Need | Map + Timeline | Network | Cross‑tabular (pivot) |
|---|---|---|---|
Geographic + temporal exploration | ✅ |
|
|
Relationship graph |
| ✅ |
|
Quantitative cross‑tabulation |
|
| ✅ |
Quick export (CSV / PDF) | ✅ (via Publish or Download timeline) | ✅ (GEXF) | ✅ |
Embedding in external site | ✅ (iframe) | ✅ (iframe) | – |
Custom pop‑ups / symbology | ✅ (Popup template) | – | – |
🔖 Key take‑aways
- Map + Timeline requires both a spatial and a temporal field; otherwise the view stays empty.
- Use the Publish button to generate an embeddable iframe; you can customise which controls appear and even export a KML for Google Earth.
- In the Network view, turning Gravity on, letting the layout settle, then turning it off yields the cleanest static graph.
- The Cross‑tabular view is ideal for quick quantitative overviews; remember to assign intervals when you need to group raw values.
- All export actions (CSV, PDF, GEXF, KML, iframe) are reachable from the respective tab’s header toolbar.
8e: Using IIIF - manifests, canvases and annotations
Note : This chapter supplement is in the Heurist gitHub /documentation/IIIF folder at 28 June 2026, but this version will becoem the authoritative source. Additonal documentation has been written since 28th June.
This guide describes the IIIF features provided by Heurist for creating, importing, viewing, editing and exporting IIIF Manifests, Canvases and Web Annotations.
Heurist supports two main workflows:
- Use Heurist as an annotation layer over existing IIIF Manifests (annotation overlay mode). The external provider keeps ownership of the source Manifest and Canvas identifiers. Heurist stores and publishes local annotations.
- Use Heurist to manage the Manifest (full management mode). Heurist stores Manifest, Canvas and Annotation records and generates a IIIF Presentation API v3 Manifest from those records.
Heurist also provides a dynamic IIIF server for ordinary record sets and registered media files, and can render external IIIF files and Manifests. In this sense it can act both as a IIIF client and as a IIIF server.
1. Preparation
1.1 Import the required definitions
Before using the IIIF annotation and Manifest tools in an existing database, import the new definitions from the Heurist_Core_Definitions database using Design > Browse templates. Heurist will prompt you to do this if you attempt to process Manifests without the required definitions.

The new record types are in the Documents group. It is enough to select IIIF Annotation. The related record types IIIF Manifest and IIIF Canvas are downloaded alongside it.

The important record types are:
- IIIF Annotation (
RT_IIIF_ANNOTATION, concept code2-109) - IIIF Manifest (
RT_IIIF_MANIFEST, concept code2-110) - IIIF Canvas (
RT_IIIF_CANVAS, concept code2-111)
These definitions include fields for IIIF identity, original/source IIIF identity, Manifest links, Canvas links, annotation state, selector type/value, annotation JSON and related metadata.
1.2 Remove obsolete duplicate fields in old databases
Some older databases may contain a duplicated field named IIIF Anotation 2 with:
- local ID:
1106 - concept code:
2-1098
This field is not used by any current IIIF record type. Remove it before using the new IIIF workflow, especially if it causes confusion in forms or import checks.
1.3 Recommended checks before testing
After importing definitions, check that the database contains the three IIIF record types above and that Browse templates no longer shows missing IIIF definitions in the Core definitions database.
For testing, start with a small Manifest first. A large external Manifest may fail for reasons unrelated to Heurist logic, such as network timeouts, remote annotation-list delays, or unavailable image services.
2. Key concepts
2.1 Manifest
A Manifest is the IIIF object that describes a digital object, such as a manuscript, book, image set or media collection. In Heurist, a Manifest may be:
- a registered external Manifest file or URL;
- a managed IIIF Manifest record;
- a dynamic Manifest generated from a record set or a single registered media file.
Managed Heurist Manifest output is generated as IIIF Presentation API v3. A registered IIIF Manifest file becomes managed only when an IIIF Manifest record references that file. If no such record exists, Heurist treats the registered Manifest file as an external/source Manifest and can use it as an annotation overlay target.
2.2 Canvas
A Canvas represents one viewable unit in a Manifest, for example a page, image, video or audio item. In full management mode, Heurist stores each Canvas as an IIIF Canvas record. Each managed Canvas normally points to a registered file or registered external media URL.
In annotation overlay mode, Canvas records are not imported or managed by Heurist. Instead, annotations remain linked to the original Canvas URI from the source Manifest.
2.3 Annotation
Annotations are stored as IIIF Annotation records. They may be created or edited in Mirador, mainly for defining the annotation area and initial text, or in the Heurist record editor for annotation attributes, which can be extended to support searching and custom reporting within Heurist.
Annotations store:
- text body / summary;
- motivation, such as commenting;
- language;
- original Canvas target URL;
- managed Canvas reference when applicable;
- selector type and selector value;
- raw IIIF/Web Annotation JSON;
- state, such as imported, Mirador-created, Heurist-created, modified, obsolete or removed.
3. Manual creation of a managed Manifest
Manual creation is used when you want Heurist to own and generate the Manifest rather than only overlay annotations on an external Manifest.
3.1 Create the Manifest record
Create a new IIIF Manifest record. Fill in Manifest-level metadata such as title, description and copyright/rights. These fields are used when Heurist generates the v3 Manifest output.
A managed Manifest can be empty. An empty managed Manifest still returns valid IIIF Presentation API v3 JSON with items: [], so viewers should not normally show a technical error.
3.2 Add Canvases one by one
Create IIIF Canvas records and link them to the Manifest. Each Canvas may reference:
- a locally uploaded registered file;
- a registered external media URL;
- an image served by a IIIF Image API;
- other supported media such as audio or video where configured.
The order of Canvas references on the Manifest record defines the order in the generated Manifest. The order can be changed within Heurist data entry by dragging the Canvas references up and down.
3.3 Add or edit annotations in Mirador
Open the managed Manifest in the Mirador Viewer. Use Mirador's annotation tools to add annotations to the selected Canvas. Heurist stores the annotation as an IIIF Annotation record and links it back to the relevant Canvas and Manifest context.
The internal Mirador viewer uses the default annotation lookup scope canvas, which reads annotations from /api/{db}/annotations. A Manifest-scoped endpoint is also available as /api/{db}/annotations/{manifestRecID} when annotation_scope=manifest is requested.
3.4 Edit annotations in the Heurist record editor
Annotations can also be edited directly as Heurist records. This is useful for correcting text, language, motivation or metadata.
Be careful when editing selector information manually:
- Selector type and selector value must remain consistent.
- A rectangular fragment selector and an SVG selector are not interchangeable.
- If the selected area is edited incorrectly, Mirador may display the annotation in the wrong place or fail to display the region.
In general, use Mirador for changing the selected area and use Heurist record editing for textual and descriptive metadata.
3.5 Open the Manifest, Canvases and Annotations from the Record View panel
From the IIIF Manifest record view, open the Manifest either as raw/generated IIIF content or in the Mirador Viewer.
- IIIF Canvas records may include a link to open the referenced Manifest in which the Canvas is used.
- IIIF Annotation records may include a link to open the referenced Manifest, so the annotation can be viewed in its wider Manifest context rather than as an isolated record.
- IIIF Canvas records can also be opened independently, in the same way as any Heurist record with a file field. This is useful when checking a single page/image/media item before opening the full Manifest.
For internal Mirador viewing, Heurist passes omit_annotation_pages=1 to the generated Manifest URL where needed. This prevents the same database annotations from being loaded twice: once from embedded Manifest annotation-page links and once from Mirador's annotation endpoint.
3.6 Add Canvases in a batch — planned feature
A planned batch action will allow users to select one or several ordinary records that already have file fields and create Canvas records from those files. This is intended to make managed Manifest creation faster for large image sets.
Until this is implemented, add Canvas records manually or import/process an existing Manifest in full management mode.
4. Import or process an existing IIIF Manifest
Use Process IIIF Manifest to work with a registered or uploaded IIIF Presentation Manifest. A Manifest can be registered as:
- an external IIIF Presentation Manifest referenced by a File field;
- a JSON Manifest uploaded to Heurist as a File field.

The default mode is Full manifest management, which creates or updates an IIIF Manifest record, imports IIIF Canvas records and imports available IIIF Annotation records.
Annotation overlay is different: it imports annotations only. It does not create an IIIF Manifest record. The registered Manifest file remains the source Manifest and Heurist stores local annotations against the original Canvas URIs.
4.1 Annotation overlay mode
Use Annotation overlay when the external Manifest remains the authoritative source for Canvas structure.
In this mode:
- only IIIF Presentation API v3 Manifests are supported;
- the source Manifest and its Canvas list remain owned by the external provider;
- Heurist does not create an IIIF Manifest record;
- Canvas identifiers are preserved from the source Manifest;
- annotations are imported into Heurist and linked to the original Canvas URIs;
- when
/api/{db}/iiif/manifest/{obfuscatedFileID}is requested, Heurist can output a v3 overlay Manifest by replacing sourceCanvas.annotationswith Heurist AnnotationPage links; - local Heurist annotations are preserved on re-import/re-processing when they have been edited locally.
Do not use this mode for IIIF Presentation API v2 Manifests. For v2 source Manifests, use full management mode. If a managed IIIF Manifest record already references the selected registered Manifest file, annotation overlay mode is not available because the file is already under Heurist management.
4.2 Full manifest management mode
Use Full manifest management when Heurist should manage the Manifest structure.
In this mode:
- Heurist creates or updates Manifest, Canvas and Annotation records;
- the existence of the IIIF Manifest record is what marks the registered Manifest file as managed;
- Heurist owns the generated Manifest output, Canvas order and Canvas metadata;
- media may still be external registered resources or local uploads;
- media should be stored in Heurist where referenced resources are not held by a stable long-term repository or institutional service;
- Manifest-level metadata can be edited in Heurist;
- Canvas order comes from the Canvas references stored on the Manifest record;
- annotations are linked to managed Canvas records;
- generated IIIF output uses Heurist Canvas API URLs.
This is the preferred mode for IIIF v2 source Manifests, because the overlay workflow is v3-only.
4.3 Re-import / re-processing behaviour
On re-import, Heurist attempts to update imported records while preserving local work. Records that have been changed in Heurist or Mirador are preserved by default and reported separately as preserved local records.
The report includes:
- managed Manifest record ID, or
not createdfor annotation overlay; - total Canvases found;
- Canvas records added, updated, unchanged or preserved;
- total annotations found;
- annotation records added, updated, unchanged or preserved;
- issues encountered during import/processing.
4.4 Thumbnails
The import tool can create thumbnails for annotation records. This is useful for browsing annotations in Heurist, but it is slower because it may need to access remote images or render selected regions.
5. Add annotations for an arbitrary registered file or URL
You do not need a managed Manifest before annotating media.
You can open the Mirador Viewer for any registered media file or supported registered URL. Heurist dynamically creates a single-canvas Manifest for the media and lets you add annotations. These annotations are stored in Heurist against the Canvas URL used for that file.
If you later add the same file to a managed Manifest, the annotation can be preserved because the Canvas identity is based on the registered file's obfuscated ID. This allows annotation work to start before the final Manifest structure is prepared.
Typical uses:
- annotate a single image before adding it to a larger Manifest;
- annotate a registered external IIIF image;
- test annotation behaviour on one file before importing, processing or building a large Manifest.
6. Viewing in Mirador
Heurist provides a Mirador Viewer for:
- a managed IIIF Manifest record;
- a registered external Manifest file;
- a single registered media file;
- a dynamic Manifest generated from a query or selected record set.
Registered Manifest files are opened through /api/{db}/iiif/manifest/{obfuscatedFileID}. If an IIIF Manifest record references the file, the API returns the managed Manifest generated from Heurist records. Otherwise it returns the source Manifest: v2 sources are returned as-is, while v3 sources can be returned with Heurist annotation-page links overlaid.
The viewer supports two annotation lookup scopes:
annotation_scope=canvas— default. Shows all annotations that target the same Canvas URL.annotation_scope=manifest— shows only annotations linked to the current Manifest record.
For internal Mirador viewing, Heurist avoids duplicate annotations by passing omit_annotation_pages=1 to generated Manifest URLs where needed. External IIIF consumers can receive normal Canvas.annotations links when this parameter is not used.
7. Dynamic Manifests via Export IIIF
Heurist can generate IIIF output dynamically from ordinary record searches and file selections. This is useful when you want to view or share a record set without creating a permanent managed Manifest record.
7.1 Single registered media file
A single media file can be opened in Mirador or exported as a IIIF Manifest by using its registered file obfuscated ID. Heurist wraps the media in a single-canvas IIIF Presentation API v3 Manifest.
Useful for:
- quick viewing of one image, audio or video item;
- adding annotations to one registered file;
- testing IIIF output for one file.
7.2 One ordinary record with media files
When a record contains one or more suitable file fields, Export IIIF can generate a Manifest whose Canvases correspond to the media files linked to that record.
Useful for:
- records that represent objects with several images;
- quick Mirador viewing without creating explicit Canvas records;
- public sharing of record media as IIIF.
7.3 Several ordinary records with media files
When the current record set contains multiple records with suitable media, Export IIIF can generate a Manifest with one or more Canvases from those records, subject to the export limit.
Useful for:
- search results containing image records;
- temporary collections;
- comparing several media records in Mirador.
7.4 One registered IIIF Manifest in the record set
If a record set contains one registered IIIF Manifest and no generated media Canvases, Heurist can return that Manifest directly through the IIIF API.
Useful for:
- opening a registered external Manifest through Heurist;
- keeping a registered Manifest discoverable as a file in a record;
- testing external Manifest access.
7.5 Several registered IIIF Manifests in the record set
If a record set contains several registered IIIF Manifests, Heurist can generate a IIIF Collection that references those Manifests.
Useful for:
- publishing a set of related Manifests;
- opening several Manifests together in Mirador;
- grouping imported, processed or external Manifests without merging their Canvas structures.
7.6 Mixed record set: registered Manifests and media files
If a v3 dynamic export contains both registered Manifests and ordinary media Canvases, Heurist can generate a Collection. Registered Manifests become Manifest items in the Collection; generated media Canvases are grouped into a generated Manifest item.
Useful for mixed search results where some records already contain IIIF Manifests and others contain image/audio/video files.
7.7 IIIF v2 output policy
Heurist no longer generates IIIF Presentation API v2 output. Dynamic export and managed Manifest output are v3-only. Heurist can still import v2 and hybrid v2 source Manifests in Full manifest management mode and then publish them as generated v3 Manifests.
8. Recommended workflow examples
8.1 Annotate an external v3 Manifest without taking over its structure
- Register or upload the v3 Manifest JSON.
- Open Process IIIF Manifest.
- Select Annotation overlay.
- Import/process annotations.
- Open the registered Manifest file in Mirador. The viewer uses
/api/{db}/iiif/manifest/{obfuscatedFileID}and the annotation endpoint. - Add or edit annotations.
- Use the same API URL when external viewers need the v3 source Manifest with Heurist AnnotationPage links.
8.2 Import a v2 Manifest with many Canvases and annotations
- Register or upload the v2 Manifest JSON.
- Open Process IIIF Manifest.
- Select Full manifest management.
- Import/process Canvases and annotations.
- Inspect the report for failed remote annotation lists or unavailable image resources.
- Open the managed Manifest in Mirador.
If the v2 Manifest is very large, test first with a trimmed Manifest containing a few Canvases.
8.3 Start with one image and later build a Manifest
- Register or upload an image.
- Open the image in Mirador.
- Add annotations.
- Later create a managed Manifest and add that file as a Canvas.
- The annotation can be preserved because it targets the file-based Canvas identity.
9. Troubleshooting
The import widget says required definitions are missing
Import IIIF Annotation from Heurist_Core_Definitions. The related Manifest and Canvas record types should be imported with it.
The database contains an old field named “IIIF Anotation 2”
Remove the obsolete duplicate field with local ID 1106 and concept code 2-1098. It is not used by the current IIIF record types.
Overlay mode rejects a v2 Manifest
This is expected. Annotation overlay mode is v3-only because it stores annotations against original v3 Canvas URIs and can publish v3 Canvas.annotations AnnotationPage links. Import v2 Manifests in Full manifest management mode.
Overlay mode is disabled for a selected registered Manifest file
This means an IIIF Manifest record already references the selected registered Manifest file. That file is already managed by Heurist, so use Full manifest management mode.
Mirador shows duplicate annotations
Use the internal Heurist Mirador viewer, which passes omit_annotation_pages=1 for generated Manifest URLs where required. This avoids loading the same annotations both from Manifest Canvas.annotations and from Mirador's annotation endpoint.
Import fails on a very large Manifest
Try a small trimmed Manifest first. Failures may be caused by remote annotation-list access, timeouts, malformed source JSON, unavailable image services, or network interruptions.
10. Summary of ownership by mode
Feature | Annotation overlay | Full manifest management |
|---|---|---|
Supported source Manifest version | v3 only | v2 and v3 |
Source Manifest ownership | External provider / registered file | Imported into Heurist management |
Generated Manifest output | Source v3 Manifest with Heurist AnnotationPage links when requested through the IIIF API | Heurist managed v3 output |
Canvas list ownership | External provider | Heurist |
Canvas identifiers | Original source Canvas URIs | Heurist Canvas API URLs |
Canvas records created | No | Yes |
Annotation records created | Yes | Yes |
Manifest metadata editable in Heurist | No managed Manifest record is created | Yes, used in generated output |
Best use | Add Heurist annotations to an existing v3 Manifest without creating a Manifest record | Build or take over a Manifest in Heurist |
8a bis: Custom reports OLD VERSION
Custom Reports are optional but they allow you to customize data display in powerful ways.
By default, when a record is displayed on a Heurist website, the usual Record View template is used. If you would like to alter how records appear, then you will need to define a Custom Report.
Note: the content was copied via markdown export and lost much of its minor formatting. The images in particalr have been downgraded. The source is here: https://docs.google.com/document/d/1Jyytaln1-aCm3paZ4rBKho0puXBGaJ97/edit
Custom Reports work together with Saved Filters to publish content on a Heurist website or elsewhere on the web. The *filter *will retrieve records from the database, and hand the records to the *custom report *to format and display them. When you choose the Report tab in the View Pane, you will see the selected Custom Report attempt to display information about your current result set. This will only work correctly if the selected report has been configured to display records like those in the result set (e.g. a Custom Report designed to display information about Persons will probably fail to display information about Books or Places properly.)
Smarty Heurist reports are powered by the Smarty Template Engine. For an overview of the Smarty template language, visit Smarty Syntax. It allows you to embed data from the database into an HTML template which determines the form of the output. You can use CSS, Javascript and even PHP within custom reports. Smarty is an extremely powerful system and almost anything is possible, if you know how.
Simple templates can produce neatly formatted lists in text (e.g. CSV and HTML formats), including media (e.g. images and videos). For example, a report might extract and display the first and last names of all writers born before 1900 along with an alphabetical list of their works.
More complex reports can be configured to retrieve and display information from related records of different nature. For instance, in the case of a database documenting archeological dig sites, excavation campaigns, and objects retrieved, each defined as a different entity, a custom template can produce a nested list of all sites, with the details of each of their respective campaigns ordered chronologically, and display a gallery with a picture of each object for each campaign.
Such complex reports can use all the power of the Smarty template language, including PHP functions (standard or user-defined) directly within the template. They can display data using complex layouts, such as grid or flexbox, and may also include JavaScript to provide interactivity and CSS to customise their appearance.
Custom reports can be used in many different places. You can use custom reports, for example, to:
Display search results on your website
Customise the popups on a Heurist map
Embed Heurist content in another page
Create periodically updated custom data feeds to be used in another platform (for instance, in csv, json, or xml format).
Report View Toolbar

The dropdown and buttons allow you to perform the following tasks:
Select dropdown. Select an existing report from the drop down. This is immediately run against the current list of queried records. This lets you test run the report against a set of records and view the report on-screen.
 Edit button. Edit the selected report template.
Create. Create a new custom report template using Smarty syntax. (Note that you can also create a new report from an existing one by duplicating it. This can be achieved using the “Save as” button at the bottom of the Edit report pane)
Delete. Deletes the current report template
Import. Import a template exported from another database (as a .gpl file). The .gpl file format is a special file format that allows templates to be interpreted by multiple databases, even if their structure differs.
Export. Export a template as a .gpl file (this can then be imported to another database). Export converts field IDs to concept IDs.
Publish. If you wish to embed the report in another website (e.g. your Wordpress site), then click the globe icon to receive some html code that you can copy-and-paste directly into the relevant page, or a URL link with your data feed.
Print. Print the report output or save as pdf.
Refresh. Use this to refresh the data used by the report template, if your database has been updated.
Create a custom report template
Tip : Before creating a new report template or editing an existing one, ensure you have run a search in order to have a data subset to test your template.
Go to Report View and from the Report toolbar, click New.

The screen that opens is divided in three panels.
The Actions Pane on the right lets you quickly enter some basic actions (conditional functions, variable and loops) based on the fields and terms available for your record query. (See Actions Pane below [@link]).
The middle pane is the Editor pane, where you can enter code manually, using HTML and the Smarty syntax. Upon creation it contains some a basic example template by default, which you can then use as a starting point or remove and start from scratch. The basic template consists of:
- Some guidance as comments, enclosed in {* *}. Remove or add comments as you wish.
- A records loop which should enclose everything you want reproduced for each record.
- Some example fields within the loop (to create a simple report wich lists the record ID and the record title).
The left pane is the Preview pane. When you click the “test” button, it will run your code on the data subset currently selected and display the output of your custom template on the white space below. Note that nothing gets saved when you click “test”.
When complete, click Save to save your report structure. If it is the first time you save this template, you will be prompted to enter a name for your template. It will now be made available for selection when you choose to print or publish the report. Click Close Editor when finished.
Actions Pane
The Actions Pane provides a records/fields tree of your database structure that assists you in creating a simple template (with loops, fields & functions) to produce neatly formatted lists in text (e.g. CSV, and HTML formats, including images, video and so forth).
More complex formats can use all the power of the Smarty template language, including PHP functions (standard or user-defined) directly in the template.
To use the Actions pane, insert the cursor in the code where you wish to insert the syntax. Press Enter to add extra lines if required. Select the appropriate record type. For each code string, first position the cursor in the appropriate location in the report, then select the appropriate function from the actions pane. In the following example, the user has created an If statement wrapper, and can now enter variable code between the If statements as required
Note. Untyped pointers do not appear on this list; instead a dialog will assist you.
To enter field variable details, for an IF Statement or Repeat Loop, click on the insert option for the relevant field. This displays the Insert dialog:
Note. You can output the leaf term alone or the leaf term with its hierarchy (where terms are hierarchical).
These have the following elements which you can insert into the code:
Insert Fields Value | Inserts the value of the selected field. From the dropdown you can specify how the field information is displayed. Field Only. Normally use Field Only. This inserts the field specification to render the content of the field as-is. Field + Function Wrapper. This inserts the field with the wrap function, which is useful for special types such as URLs, images and videos, as it inserts required html code, for example: {wrap var=$r.recURL dt="url"} inserts a hyperlink. {wrap var=$r.thumbnail_image_originalvalue dt="file" width="300" height="auto"} inserts an image. |
|---|---|
Test Value (IF) | Click this button to insert a test value for the loop. |
Preview Results
To preview the results of your template, click TEST. The report output is shown in the bottom Pane (only a subset of the data is shown, for efficiency).
The two dropdowns let you set the the scope of the query (for the test only, not the published report), and to troubleshoot the code (show warnings, show errors etc.):
The test results are updated immediately.
Edit, Copy & Delete Template
To edit a template, go to Report View, select a report from the Select Template dropdown. Click Edit . The Template screen Displays. Edit the template as required (see above). When complete, click Save, or Save as to create (copy) a new report from an existing report. Click Close Editor when finished.
To delete a template, select a report from the Select Template dropdown and click Delete .
Warning. If you delete the report template at the next step you cannot retrieve the report again.
Click OK at the prompt to delete the report.
Report Basics
To get started with a custom report, you need to understand the basics of html and the Smarty syntax.
https://heurist.huma-num.fr/heurist/
Topics to be covered
@todo: these links go to the old pages
Editing a Report Template: How to create a basic report to show data about your records in a customised format
Publish Report: How to embed a report in an external website, or how to schedule large/complex reports to be regenerated and cached in the background
Advanced Usage: How to use all the features of the Smarty templating language and Heurist's report editor
Custom Reports Cookbook: Some recipes for commonly-requested features of custom reports, e.g. linking reports together or displaying records in an interactive table. The cookbook also has some tips for making the code of your reports more readable and easier to maintain
The basics are explained below. For more detail, see the help pages on Editing a Report Template, Report Publishing Options and Advanced Usage.
Publish Report
The publish option allows you to embed a custom report in an external website (e.g. a Wordpress blog). It also allows you to schedule reports to be regenerated periodically and then cached. Scheduling reports is a good option when you are generating large or complex reports, e.g. tabular displays of lots of data, or reports that perform complex computation or statistical analysis.
You can access the 'Publish Report' dialog by clicking the globe icon in the Report View:

In this view, you will see some code that you can copy-and-paste into your website to make the report appear. This code will generate the report with whatever records you are currently viewing in the Explore Menu. You should using a filter to ensure that the correct records are selected for the published version of the report. For example, if you would like the report to show every 'Film' in your database, then you should filter the database just to show the 'Films' before opening the 'Publish Report' dialog.

If you find that the 'embed' code does not work in your website, you can try the 'javascript wrap' option. You can test out the generated report by clicking 'open in new window'.
Scheduled Reports
Use the Set up up publishing schedule button to periodically regenerate the report according to a defined schedule. This is a good option for complex reports that are slow to generate. By generating the report in advance, you will provide a better experience for visitors to your site: a cached version of the report will be waiting on Heurist's servers to be downloaded instantly by the visitor. The drawback of this approach is that visitors may not see the most up-to-date information. They will instead see a snapshot of the database at the time the report was generated.
When you click on Set up publishing schedule, you will see a list of scheduled reports. This list will of course be empty if you have set up a publishing schedule before.

Click the icon in the 'edit' column to change the settings of the publication schedule, the icon in the 'exec' column to regenerate the report, or the icons in the 'html' or 'js' columns to obtain a copy of the code to embed into your external website. You can delete the publishing schedule by clicking the icon in the 'Del' column.
NB: This screen only edits or deletes publishing schedules. If you want to edit or the delete the actual report, then you need to go back to the 'Report View' and click the relevant icon.
When you click the edit icon, or the 'Add New Report Schedule' button, then the 'Edit report schedule' dialog will appear. If you are creating a new publication schedule, then the 'query' and 'template' fields will automatically be filled in for you. You will simply need to provide a title for the publication schedule, which is purely for your reference.

ID | This identifies the published report and will be generated when the report is published. |
|---|---|
Title | The title of the generated report. |
Type | Select the type of report (i.e. the report syntax used). Note. Currently only Smarty reports are supported. See . |
File Path | The file path where the report is generated to. Leave blank to use the default path which is: datbasename/generated-reports |
File Name | The base name of the report files. This will be completed with file types. |
Query | The Heurist query you used as a base for the report. This is required since the reports are generated dynamically, using the current set of records. |
Template | The name of the template used to generate this report (defaults to current template). |
Interval | To schedule a report to be run regularly, specify the interval in minutes between regenerations of the report output. The default is zero (only run on demand). Leave blank for no schedule. |
When complete, click Save. Your report schedule will be added to the list of scheduled reports.
Editing a Report Template
You can create custom reports templates using the Smarty Report Engine. These templates then become available in the Report toolbar to be run against any result-set.
About Smarty
Note. Smarty is open source software, developed by the developers of the PHP programming language. Heurist uses the latest release of its software. This version is optimized for web servers that use PHP5. Any templates you create via the Report View adhere to the same syntax and structure of Smarty templates; all standard Smarty template plugins and modifiers can be used, and your templates are parsed, cached, and displayed by the latest release of Smarty.
Smarty works by allowing you to incorporate various variables and plugins into the HTML syntax of your reports. This gives you complete control over what is displayed to the end user. Smarty files are basic HTML files that can be edited in any text editor; you do not need to install anything extra to use Smarty. You therefore have complete control over the HTML displayed to the end user. You can link Smarty files to JavaScript, CSS stylesheets, and other files.
Note. Reports work with record type and fields codes rather than names; this prevents formats being broken if field names are edited.
You can get started developing Smarty-based templates with a modicum of Smarty knowledge. As you learn more about Smarty you can develop more sophisticated templates. For example, the following snippet of code is used to display a list of the five latest news headlines on a news site:
<ul>
{content type="headlines" var="headline" limit="5" sort="date" sort_dir="desc"}
<li>
<a href="{$headline.link}">{$headline.headline}</a> ({$headline.date|date_format: "%m %d, %Y"})
</li>
{/content}
</ul>
(See the Smarty Syntax section (next) for an overview of the smarty syntax, including worked examples. For complete Smarty Documentation go to the Smarty Site itself.)