
8a: Getting started with custom reports
Documentation rédigée le 06/11/2025 par Shannon Bruderer mise à jour le 05/12/2025 par Shannon Bruderer
What is a Custom Report ? :
A Custom Report is a template that structures your database records into various output formats such as HTML (for web display), plain text (for transfers without formatting), CSV (for spreadsheet work, e.g. in Excel or Open Office), JSON (for data feeds), or XML (for tagged data exchange).
Note however that CSV, JSON and XML are handled much more easily in the Export tab in Explore unless some very specialised formatting is required.
The development of custom reports can be quite a slow process, so it is best to plan well what reports you need and apply good naming conventions. Some level of simple HTML will be required, and knowledge of CSS will allow for much greater control of the output. PHP and JS functions can also be included (optional).
Custom Reports are useful when you need to extract and format specific data for further analysis or publication. They are particualrly useful in formatting data to appear in web pages (see chapter 9). They can also be used to download formatted information or set up feeds of data for other purposes.
They are also useful for displaying a single record in Record View, a popup on the map, or wherever data needs to be displayed in response to selection of one or more records.
Tip : Before creating your Custom Report, define clearly what sort of display you plan to do. Your formatting goal will determine both the data you select and the way you format the output.
Reports are built using Smarty, a templating language that combines standard HTML with Smarty tags to dynamically insert data from Heurist.
You may see this message above your report format in the middle panel. CSS and JS are disabled by default in report formats and websites generated by a database as a security precaution, to avoid unwanted actions from parasitic databases. If you wish to use these - many websites will want to customise their appearance or behaviours more than the default settings allow - you should contact the server adminstrator who will add the database to a list of authorised databases.

If you change the name of a database, clone it or create a new database it will not allow CSS or JS.
The new name will need to be added to the list.
How to start :
You may wish to perform a more flexible filter, either by entering it in the Filter field ③ or using the Filter builder or Facets builder just below it, or use a [Saved Filter] from the Filters ection ② that returns the records you want to include in your report.
The selected records will appear in the middle section of your screen. ④
To work with Custom Reports, click on the [Report] tab ⑤
The Custom Report template for your filtered data will appear below the [Report] button.

The report shown in the backend interface is limited to 50 records by default (can be increaed to 200 or 500 in Design > My Preferences) and ends with a line stating this limit, as it is really designed as a preview function. To view the full results click the globe or download icons - see below).
The Toolbar
In the upper part of the Custom Report tab, you’ll see a toolbar:

Edit Tool

Click [Edit] to open the template editor and start writing your Custom Report with Smarty.
The editor is split into three panes ①, ⑤ and ⑨
 :::info Tips :
Actions pane ① :
Insert fields, loops, and conditions via dropdown helpers ②, and a tree view ④ selected with the record types dropdown ③
The tree view ④ allows you to select multiple fields, including from the metadata attached to each record (ID, date of addition, owner etc.), the method of representation of term fields (label, description, code), and to drill down into connected records through record pointer fields or relationship markers.
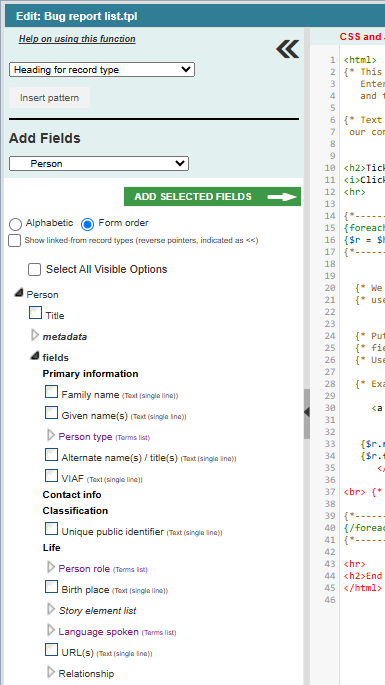
The fields can be organised in record form order (default view, showing the tabs and headings in bold font), or in alphabetic order. The tree can also show record types which have record pointers pointing TO the record type selected (Show linked-from record types checkbox)
Having selected one or more fields, make sure the cursor is positioned where you want them inserted in the report format and click Add selected fields. This will display the following popup;
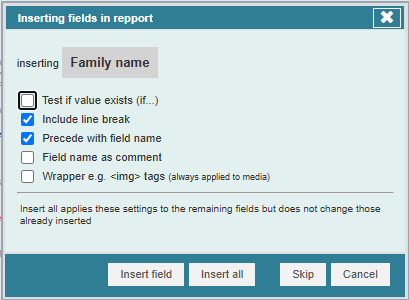
By selecting the checkboxes you can accompany insertion with various additional functions and pieces of information - the two selected by default will be useful in many cases to get some sort of reasonable default output.
Fields can be inserted one-by one (Insert field) allowing the accompanying information to be changed between fields, or you can insert all the remaining fields with the same accompanying information by clicking Insert all. Fields can be omitted with Skip.
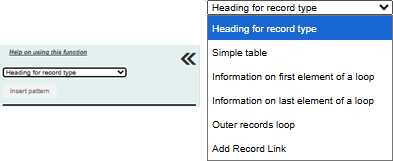
The pattern insertion dropdown ② above the treeview function allows insertion of a number of simple html patterns such as tables and record links, as well as patterns to carry out some action eg. writing some label or separator, at the beginning or end of a loop. Note that the list of available patterns may change as new capabilities are added.
Editor pane ⑤ : write and edit your HTML + Smarty template here.
In the editor, you’ll see the template you selected or the default starter message/template (note that this template may change through time as we improve on it, but it will contain a basic loop for records and some instructions at the end to help you get started).
{* This is a simple Smarty report template which you can edit into something more sophisticated.
It should give basic output for any database, as it uses the standard record types which are part of all databases.
Enter html for web pages or other text format. Use tree on the left to insert fields, loops and tests.
Use this format to include comments in your file, use <!-- --> for output of html comments.
Smarty help describes many functions you can apply, loop counting/summing, custom functions etc. *}
For Smarty syntax please see the following chapter (8b).
Preview pane ⑨ : shows the output when you click [Test] ⑧ .
You can choose to truncate the preview to n records ⑥ and select how to handle debug messages, warnings, and errors ⑦.
Click [Test] to preview ! Nothing is saved when testing.
Use [Save] (or [Save As]) to store your template and keep versions.
Use Ctrl+Z / Cmd+Z to undo recent edits. You can undo a lot of edits by repeating this.
We strongly recommend using the test function frequently making only one or two changes at a time and clicking Test to see the results. If somethign doesn't work, you can immediately undo it and try an alternative. Undo can be applied repeatedly.
Don't get tempted to write a lot of code and then test it because then you will have trouble finding the problem.
Rename

Allows renaming of an existing template. Note that if a template is renamed, any URL or scheduled regeneration which uses the old name will fail.
Create a new template

[Create a new template] works similarly to the [Edit] tool. It opens the same editor interface where you can create a new Custom Report template from scratch.
Use it when you want to start a fresh layout instead of editing an existing one.
For Smarty syntax please see the following chapter (8b).
Delete the Selected Template

The [Delete] tool allows you to delete the currently selected template.
When clicked, a warning message will pop up asking for confirmation.

It will display the name of your template ① like name_file_.tpl . As here for exemple "Basic (inital record types).tpl"
Click [Proceed] to confirm deletion, or [Cancel] to abort the action.
Import and Export Templates


The Import ← and Export → tools allow you to share and reuse Custom Report templates.
For this we have developed a 'global template' format (.gpl) which uses Heurist's unique Concept IDs so that the template can be usd by any database that includes those concepts (definitions of record types, fields and terms). Template files stored in the Heurist database are the same as global files except that they use local codes rather than the unique global concept IDs.
Templates can only be exported from a registered database to ensure that there are Concept IDs for any definitions used in the template. If the database is not registered you will see the following message.

Import lets you upload an existing global template file (.gpl) and convert it to a local template file (.tpl)
Export lets you download your customized template as a .gpl file, so you can back it up or share it with others.
Obtain the URL, JavaScript to embed a report, and set a publishing schedules

The [Publish] option lets you :
- embed a Custom Report in an external website in another CMS
- schedule periodic regeneration with caching for faster load times on large/complex reports.
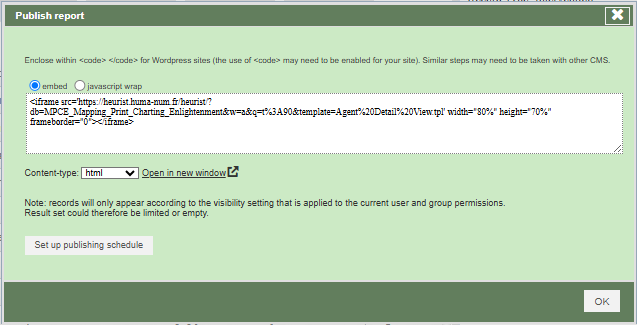
Embedding
The dialogue above gives an iframe instruction to embed the report into another website. Switching to javascript wrap will give an alternative text such as:

The Open in new window link is a useful way of seeing the report cleanly and for obtaining a URL for use elsewhere.
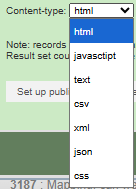
The Content-type dropdown allows a number of differnt output formats to be specified, setting a parameter on the URL used by Open in new window. html and text are the two most useful, the others produce generic outputs which may or may not be of any use. To obtain text output, do not include any html tags in the report format.
Setting up a scheduled (cached) report
Pros/cons of scheduling
Much faster for large tables, complex calculations, or media-heavy pages.
Content is a snapshot at the last generation time (not strictly real-time), so frequency of update needs to be approriately set
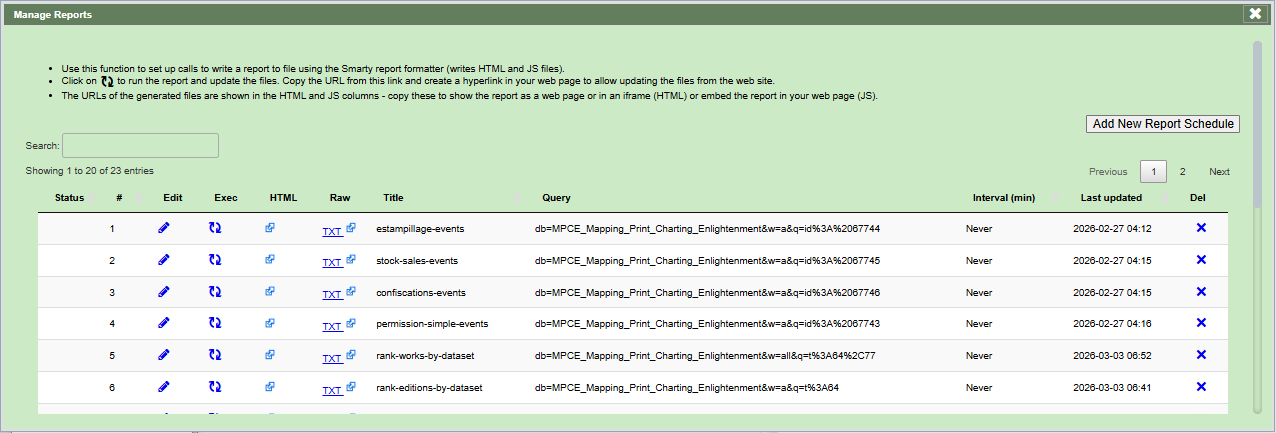
The first screen shows any existing scheduled actions:
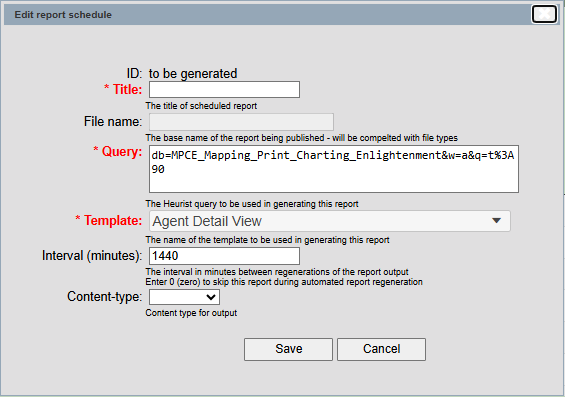
Adding a new report schedule pops up a dialogue to define the parameters of a new schedule using the current filter ("Query") with a number of different options - a title to identify it, the report template to be used, the frequeny with which to regenerate the output (the default value of 1440 minutes = daily, 0 = only manual regeneration, which is useful for data that will never, or very rarely, change).
Download

This allows the download of a plain text file without html formatting (assuming you did not use html tags in the report format)

The [Print] buttom simply generates a PDF of the output from your current Custom Report template. It’s a quick and convenient way to export information in an easy readable and shareable format.
Tip: Don’t hesitate to use this feature to:
Enrich your Data Management Plan (DMP),
Place in a hardcopy archive,
Keep track of specific datasets, or
Share information with colleagues who may not be comfortable navigating Heurist or other “sophisticated” data formats.
Refresh

Click on the [Refresh] buttom to update the data used by your Custom Report template. For filters other than Facet filters (where you must make surther selections) you may also simply hit the Filter button to rerun the filter, which will cause the report to be rewritten.
If your database has been modified (new records, edits, deletions) but the output of your report does not reflect these changes, simply hit Refresh to reload the most recent data and ensure your preview is accurate.
No comments to display
No comments to display